
Yield and Quality Revolution in Semi-Conductor industry: Deep Topological Analysis
Explainable machine learning approach to yield and quality improvements using deep topological data analytics
Analysis process for one of the major semiconductor inductry problems - production yield
Introduction
A vast amount of data is collected in wafer fabrication and routinely analyzed to ensure that there are no process deviations that may result in loss of product quality and wafer yield. Characterizing and determining the factors which cause these deviations is crucial to drive corrective actions and improve production cost.
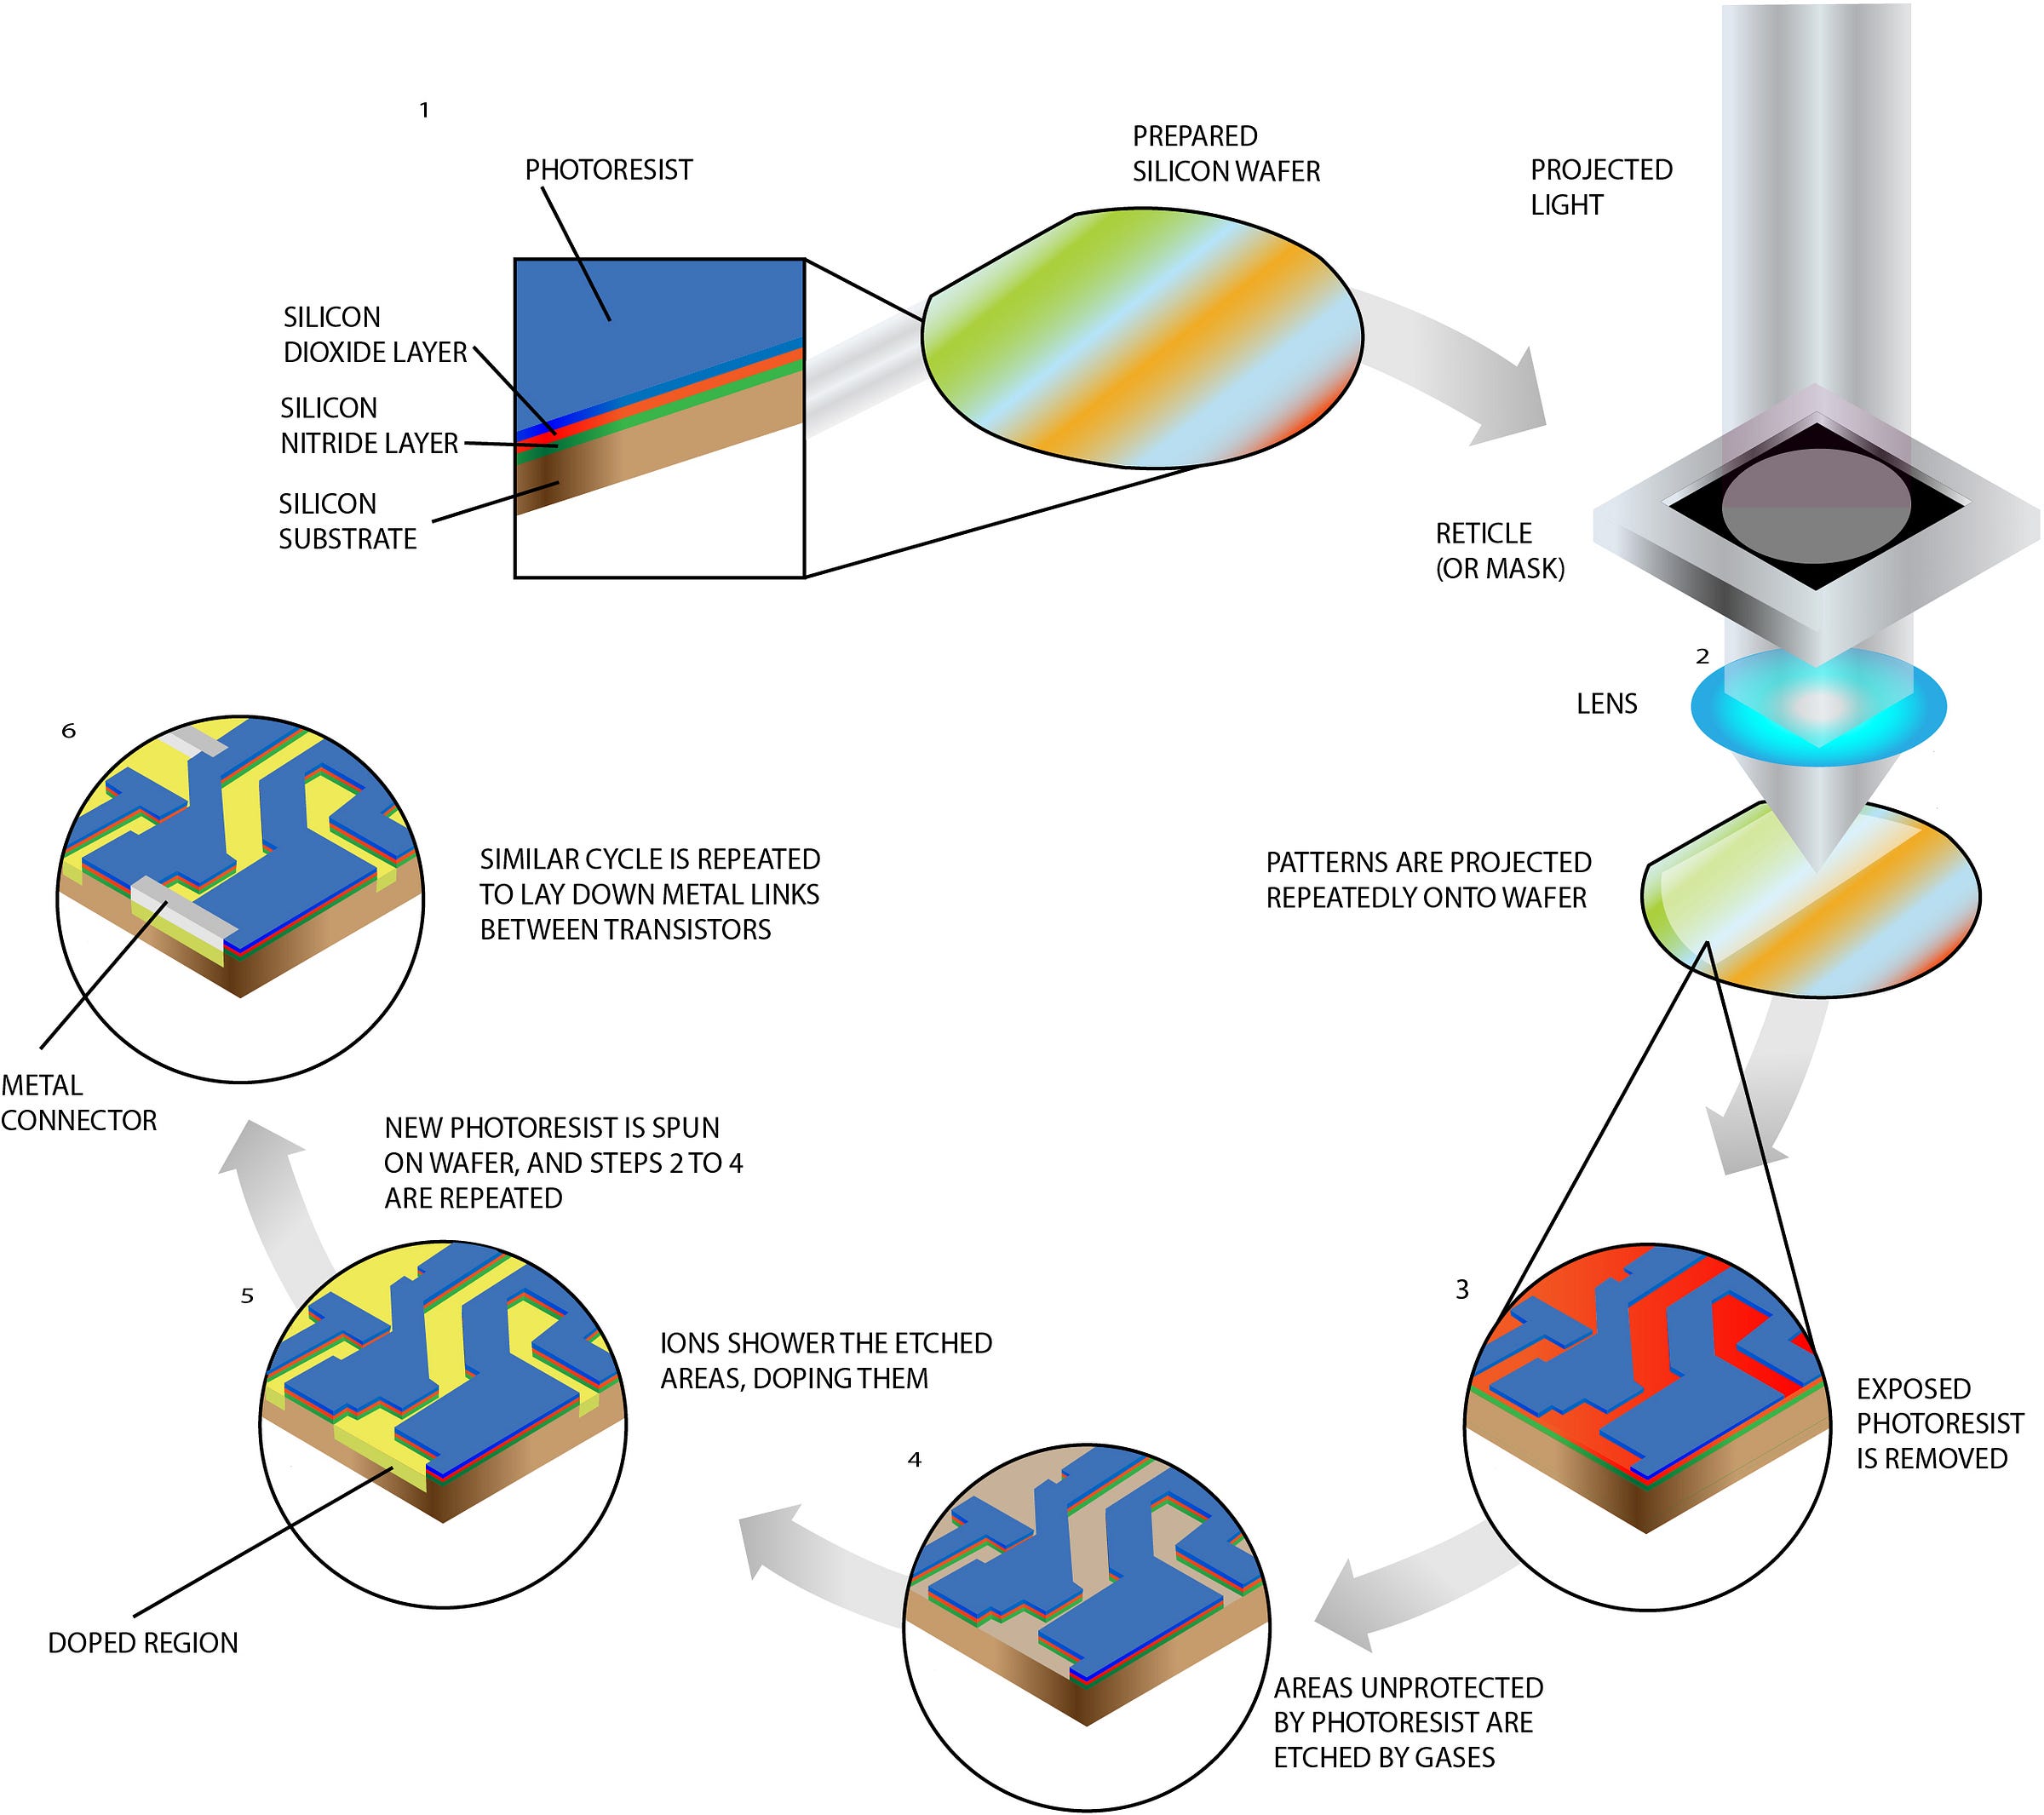
Figure 1: Manufacturing process of basic silicon wafers(source)
Big Data shifted how we collect, store, and analyze data and enables engineers to link an infinite number of features to a single wafer/die. With the number of wafer process steps above a thousand, engineers can link tens of thousands of features together to describe a wafer/die, and it is not even close to what maximally possible. A dataset that has more features (columns) than data points (rows) is often referred in the literature as high dimensional data. The low number of data samples with less than 5% of positive labels adds significant complexity to the analytics and described as highly imbalanced. Due to the high variations of wafer workflows, especially in NPI phase, we also have features that are not present for a handful of wafers increasing the sparsity of the analyzed data.
To describe yield and quality root cause analysis in term of data analytics, we can state that the challenge is to find a set of features in a highly dimensional, imbalanced, and sparse dataset that provide statistical confidence in predicting positive labels. The conventional methods used for dimensionality reduction, feature selection, and visualizing such high dimensional dataset include:
- principal component analysis (PCA),
- partial least squares (PLS),
- Uniform Manifold Approximation and Projection (UMAP),
- t-distributed stochastic neighbor embedding (t-SNE).
However, these methods are known to be sensitive to noise and outliers, are linear, require specific probability distributions and perform poorly with sparse and imbalanced data. Another requirement for these types of analytics is that engineers are not only interested in the features that can predict a certain type of failures, but they must understand why, so they can execute corrective actions. Explainable AI/ML (XAI) is a new field in data science with several on-going research studies and of high importance in making industrial AI/ML applications successful.
Topological data analysis (TDA) is an unsupervised machine learning approach which aims to determine the unknown topology of the high-dimensional manifold where the data resides to extract the hidden patterns [1] [2]. TDA defines the relationship between shapes through abstract topological shapes instead of traditional geometric meanings. TDA when combined with deep generative models results in a unique XAI technique referred as Deep Topological Data Analysis (DTDA) that identifies hidden structures within dataset, clusters them according to the patterns found.
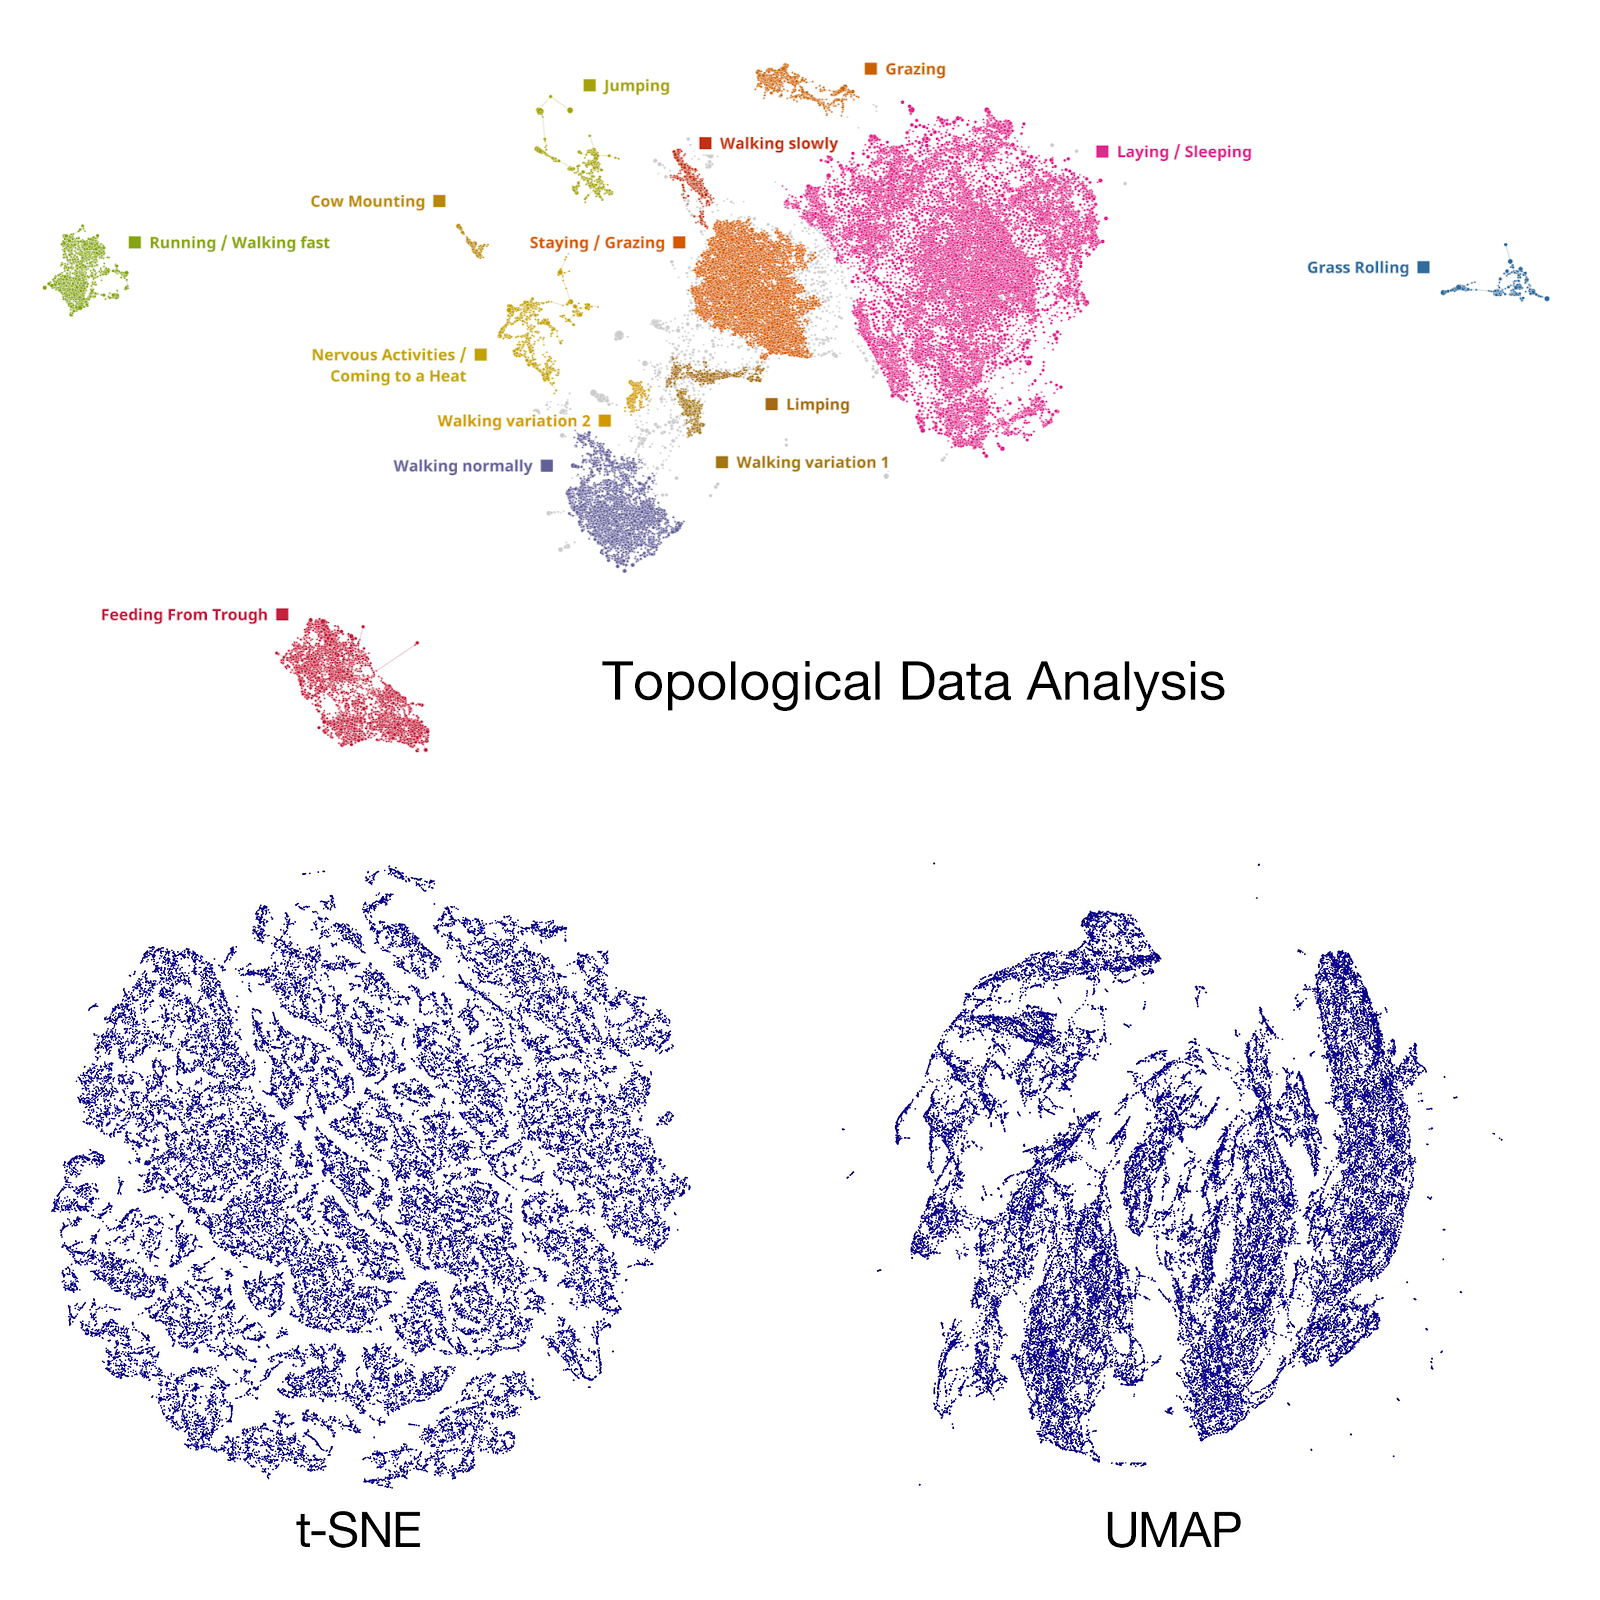
Learn more in a separate article comparing TDA with other approaches of data visualisation:
Our main objective is to demonstrate the effectiveness of the DTDA approach in improving yield and quality in manufacturing processes while providing a clear and interpretable explanation of the decision-making process.
Materials and methods
Wafer yield and quality management is a critical task for semiconductor manufacturers. A lot of effort has been conducted in both industry and academia to improve the wafer yield. However, existing yield and quality management approaches typically only consider a single process or a few processes. A more comprehensive approach is needed to fully utilize the potential of process operational data to improve wafer yield. This approach should consider all the processes involved in semiconductor manufacturing, as well as the interactions between these processes. It should also be able to identify and respond to potential yield issues in real time.
One of the very well-known challenges here is first, the sheer volume of data that needs to be collected and analyzed. Another challenge is the complexity of the semiconductor manufacturing process. Effective data mining approaches are thus required at various stages of the semiconductor manufacturing life cycle. As indicated in the review article [3] smart data mining approaches can help significantly improve yield, process control and product development. Finally, it is important to develop an approach that is cost-effective, robust, and scalable.
TDA when applied to high dimensional data, reduces the muti-dimensions to two dimensional networks composed of nodes (or clusters) of similar samples and edges connecting the nodes with overlapping characteristics. This approach could be extended to determine which features are relevant to the outcome (or target). The predictive model built using these selected features resulted in high prediction accuracy. The Mapper library requires user to pick several parameters which is mostly trial and error with no defined metric to determine which one of the obtained TDA maps is the actual representation of the input data. We, therefore, investigated other python based open-source packages besides Mapper and realized the drawbacks of working with open-source TDA packages. These packages would work fine for exploration purposes with small datasets and for POCs but were devoid of readiness for enterprise level applications. After thorough analysis, we picked DataRefiner as the platform for conducting topological data analysis. In our collaboration with DataRefiner team, we developed several customized features in the platform that would help with the post-processing and interpreting of the TDA maps for semiconductor manufacturing yield and quality use cases.
Pipeline for analysis and modeling using Deep Topological Data Analytics (DTDA)
Figure 4 illustrates the overall approach for high dimensional visual analytics. DataRefiner's Deep Topological Data Analytics (DTDA) engine is utilized for data mining, visualization, feature selection for predictive modeling from the high dimensional, sparse, and extremely imbalanced datasets encountered in semiconductor manufacturing.
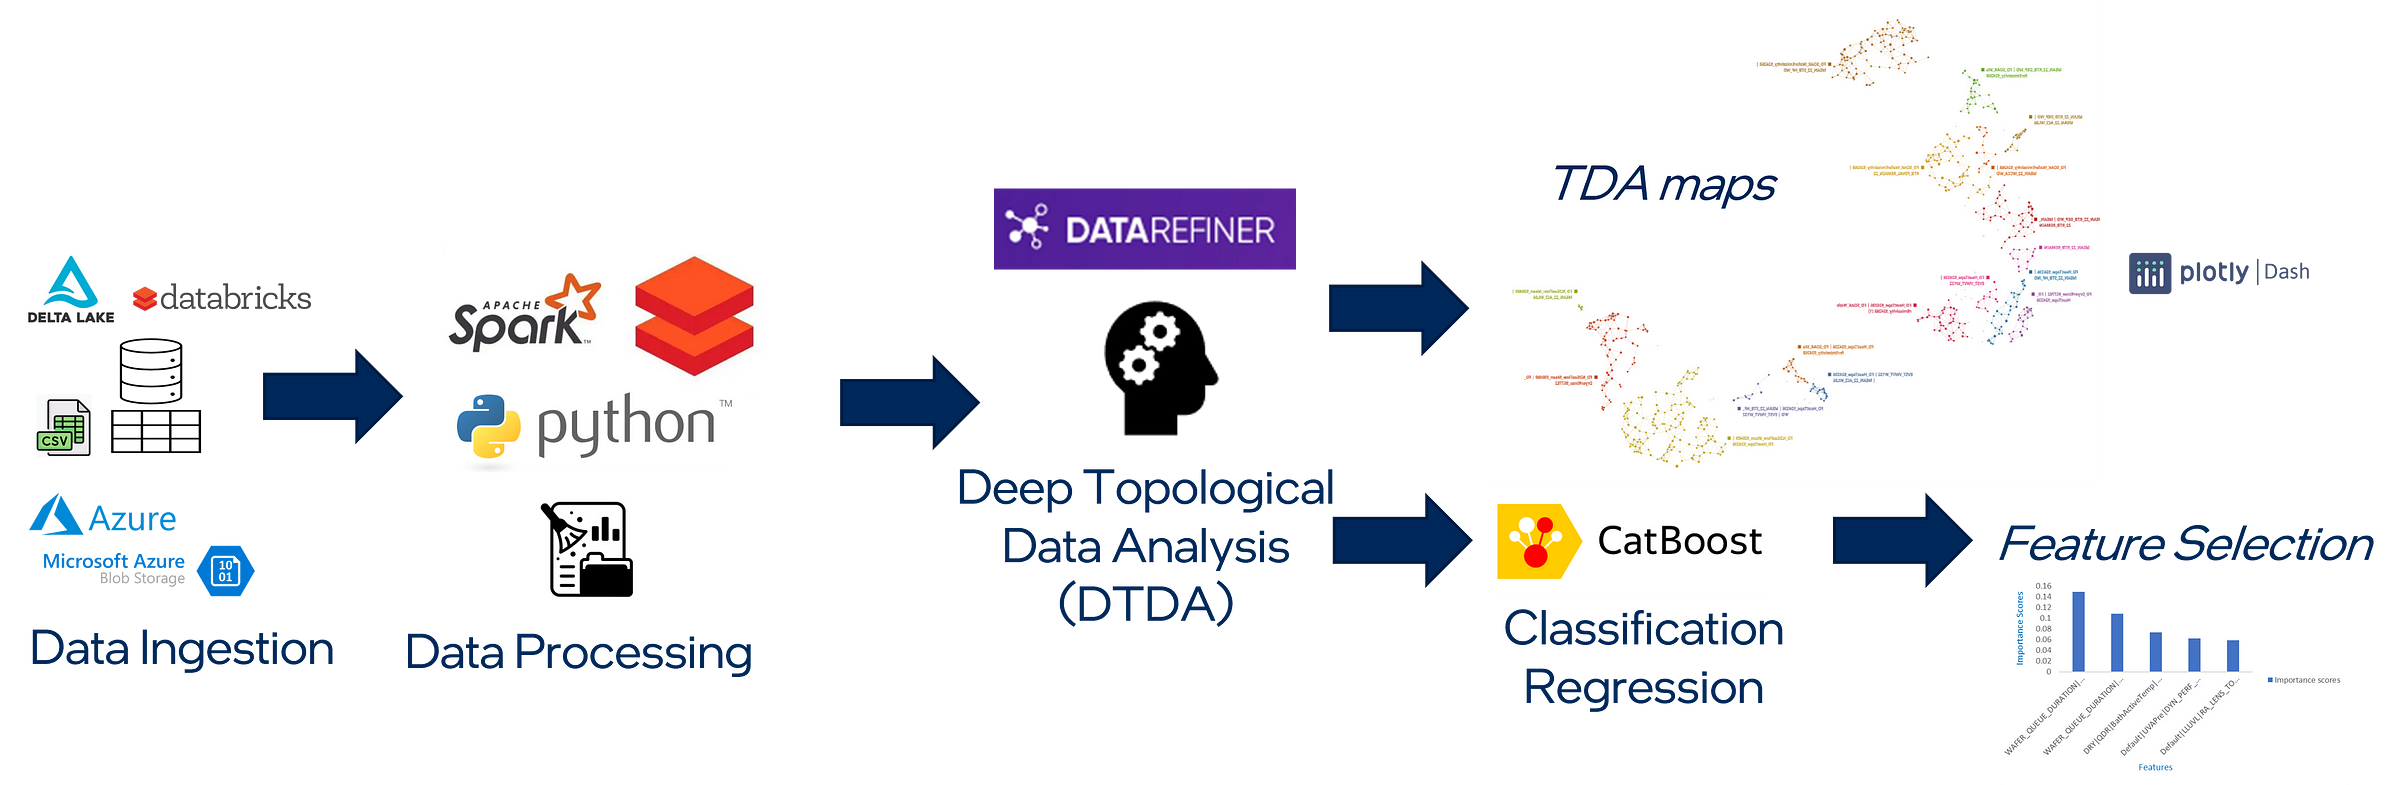
The following sections present the detailed step-by-step process shown in Figure 1 consisting of four phases: (A) data ingestion, (B) data processing, (C) deep topological data analysis, and (D) post-processing (TDA maps / Feature selection).
A. Data Ingestion: The platform accepts tabular data in form of csv files which a user could upload straight to the platform, or it could be pipelined through an on-prem database or cloud storage such as Microsoft Azure blob storage and Databricks Delta Lake tables.
B. Data Processing: The input variables of the dataset comprise of various data subsets corresponding to wafer manufacturing for ex. the toolset, recipe, sensor parameters, electrical measurements, metrology measurements etc. The dimension of dataset can span from several hundreds to 10k+ columns. The dataset therefore includes both categorical and numerical datatypes. To prepare these datasets for analysis, pre-processing and cleaning are performed utilizing Databricks Spark and Python libraries. Columns with 100% null values are dropped. Based on use case, rows containing one or more columns with null values could be dropped as well. Categorical features are one-hot encoded. When supervised training is included, the dataset is split into training and test sets where the training set is used for model optimization and selection. The platform itself performs many data verifications to ensure the integrity of the data as well as suggests user on the changes to improve the results. For example, distribution correction is an option that user can enable or disable based on their use case.
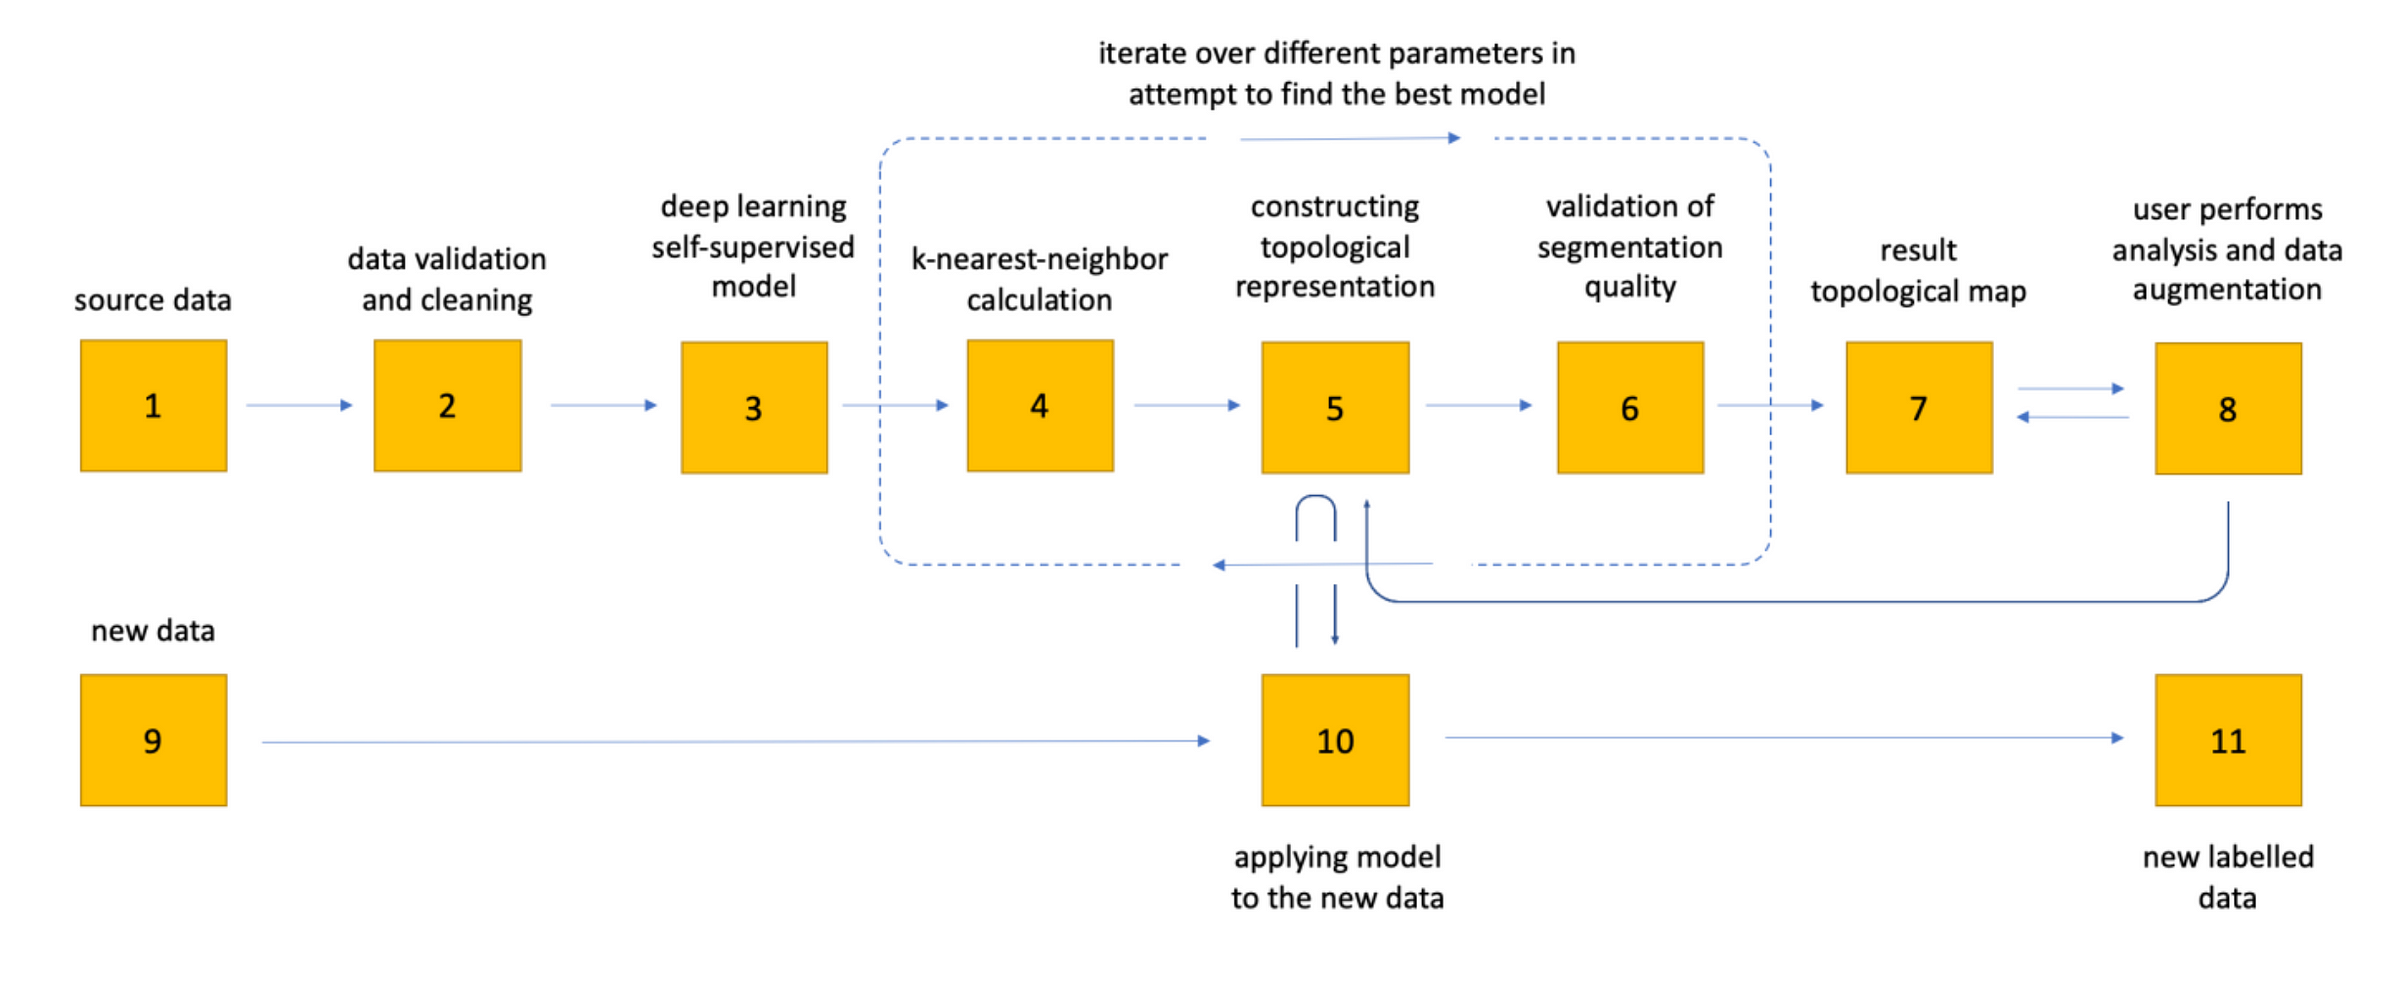
C. Deep Topological Data Analysis: It is a process of transforming pre-processed data on the previous step into a topological map for user analysis. This process can be presented as 11 step process as shown in Figure 5.
- The initial step involves acquiring the source data, which can take various forms such as numerical matrices or raw text. In the case of raw text, the system internally performs necessary transformations.
- A series of data verifications is conducted by the system to ensure data integrity while also providing suggestions to the user for improving the results.
- An optional stage involves the application of a self- supervised deep generative model specifically designed for extracting high-level parameters from the data, enhancing the quality of data segmentation.
- Employing a scalable nearest-neighbor algorithm utilizing gradient descent, this module enables efficient processing of vast datasets, even reaching hundreds of millions of records.
- The system employs an iterative approach to perform topological optimization, aiming to identify and characterize homology groups, thereby representing the topological structure in both 2D and 3D spaces.
- Validation of the resulting topological structure is carried out, involving the adjustment of meta-parameters and reiteration of steps 4, 5, and 6 to generate new candidates. The most optimal candidate is selected as the final result.
- The final topological structure is presented to the user for analysis and interpretation.
- The user engages in analysis of the structure, comprehending its intricacies, and may make alterations to enhance the quality of segmentation. The user can also define groups and additional structures for later supervised steps.
- Once the structure is refined, the user can provide new data with a similar structure.
- The learned model is then applied to the new data, yielding segmentation results based on the acquired knowledge.
- Finally, a new labeled data file is generated, which can be conveniently accessed for download through a web interface or an API.
D. Post-Processing (TDA Maps/Feature Selection): The DTDA engine segments the data based on their shared characteristics outputting data maps or graphs. These maps are composed of nodes which are clusters containing samples from the data that exhibit similar characteristics. Edges connecting the nodes are clusters containing samples that have overlapping characteristics. Top features of the dataset resulting in data segmentation are found. Every cluster is clearly explained. Significant feature correlations are determined at cluster level as well as it is possible to determine how the features are correlated at global level. Cluster to cluster comparison allows user to determine the critical features that differentiates the clusters. Precise rules that separate a selected cluster from rest of the data is also determined. The distribution of 'target' or 'outcome' is visualized by overlaying over the generated data maps. Interesting data segments could be then identified based on these overlays.
Results and discussion
Use case 1
We intent to test the hypothesis with empirical data that the given dataset contains one or specific combination of process flow variables that are resulting in the observed failure that we aim to root cause. For proprietary reasons, the exact names of variables and devices are not revealed. The input variables include process operating conditions, time spans, equipment units, and sensor parameters. These are essentially the common fields that are chosen for yield analysis. Various fabrication data are then combined with each wafer to organize the input variables in two-dimensional form such that each row corresponds to a wafer and columns correspond to the process flow variables. The data are restricted by the wafers of a specific product with 'target' defined for supervised learning, wafer failing/passing the pre-decided criteria are encoded as '1' for fail and '0' for pass. The use cases described here correspond to reported wafer failures observed end of line. The challenge here was to determine the root causes of failures considering the underlying imbalance, high dimensional, and sparsity of the datasets.
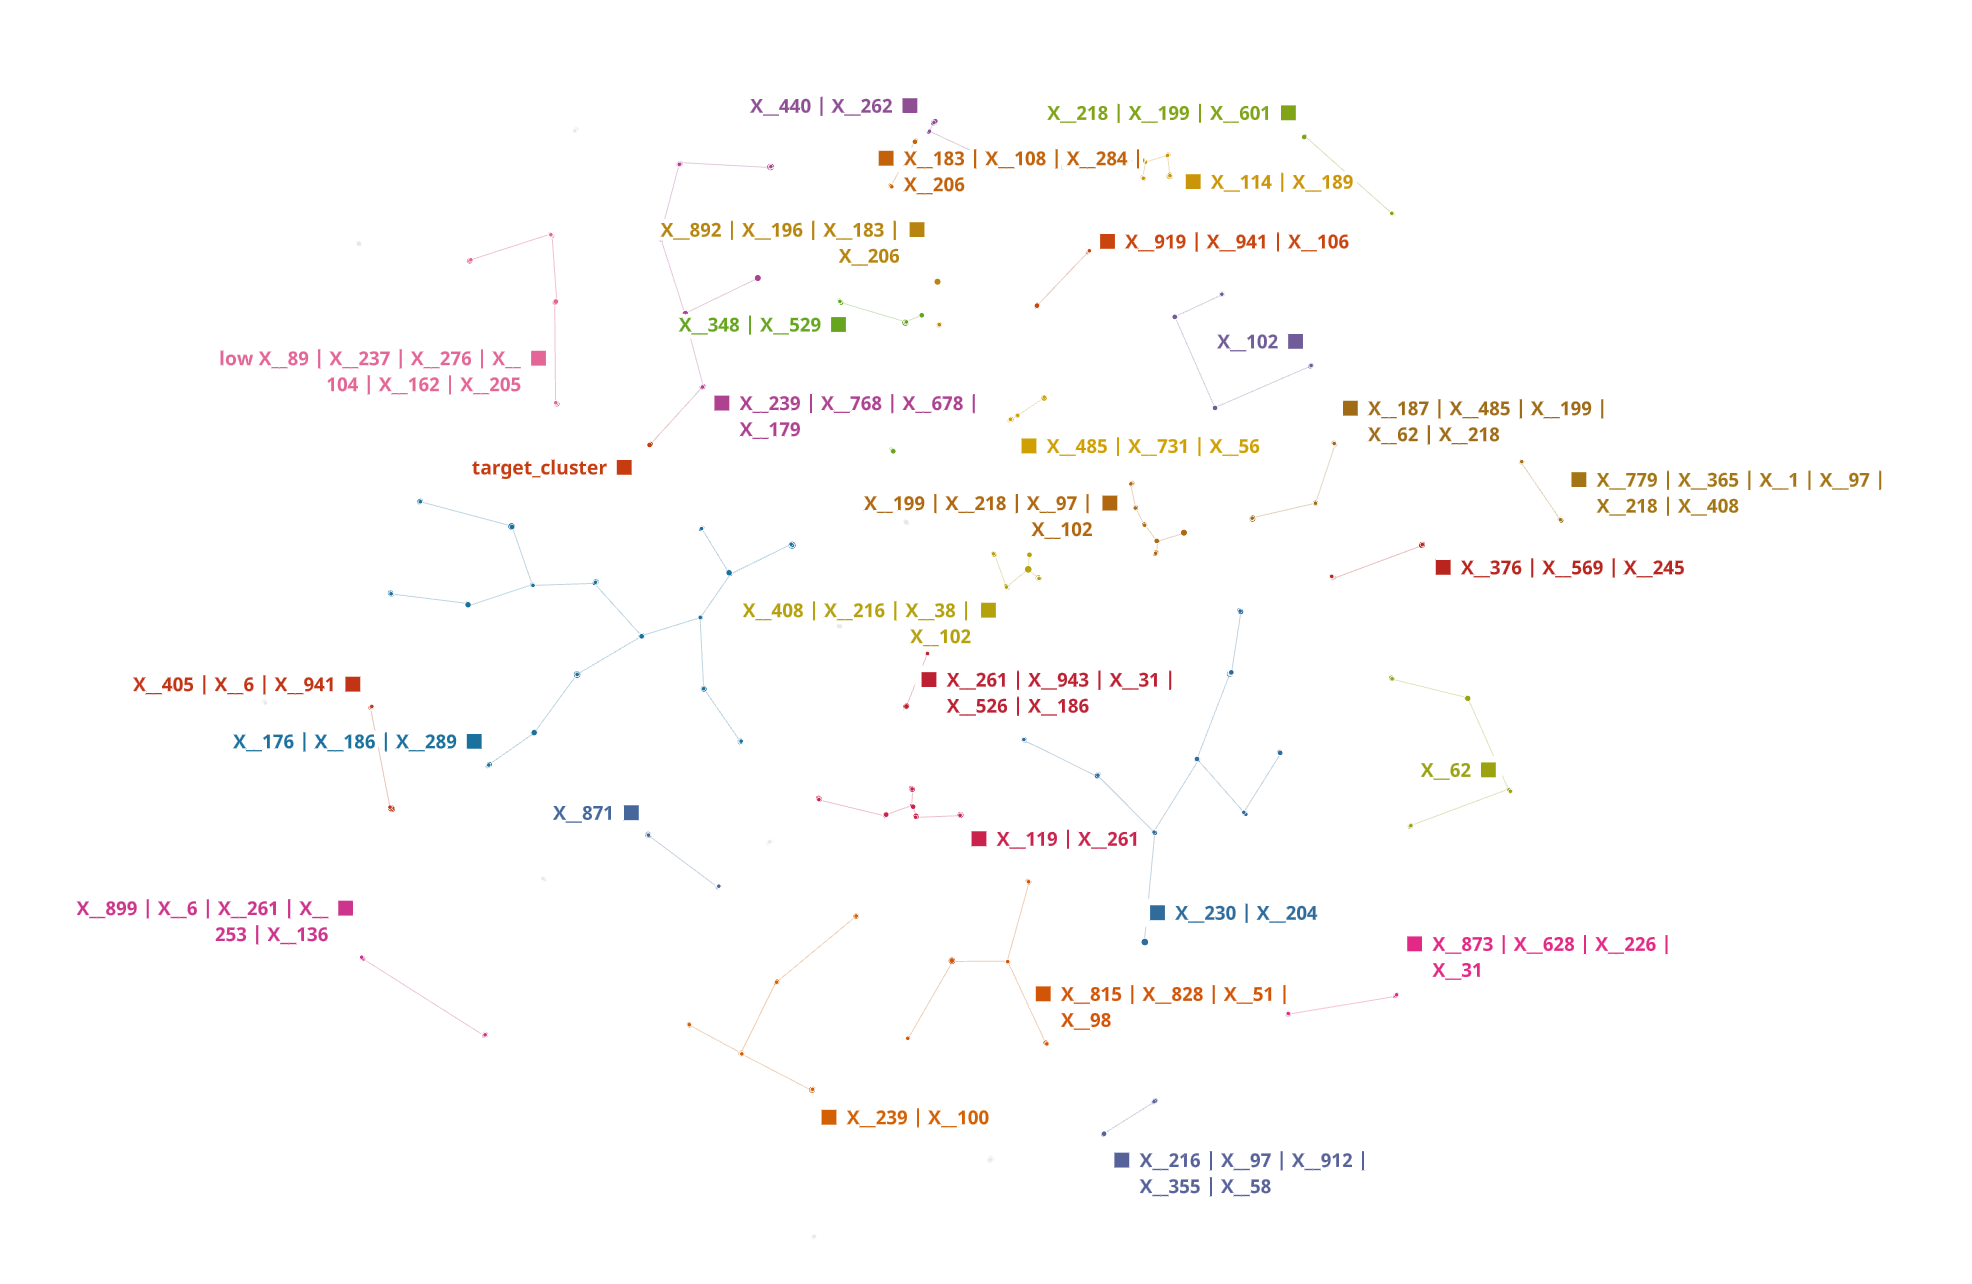
The first use case comprised of 2952 wafers (rows) and 974 wafer process flow steps (columns). Out of these 2952 wafers, there were 15 wafers that were failing which was only 0.5%. Our hypothesis was if the given dataset contains one or specific combination of process flow steps which are causing the failure then we should be able to identify those through the unsupervised DTDA approach. Our approach successfully clusters all failed wafers into a single cluster fully unsupervised. The resulting TDA map from this dataset is shown in Figure 6, where the cluster 'target' contains all the 15 failed wafers.
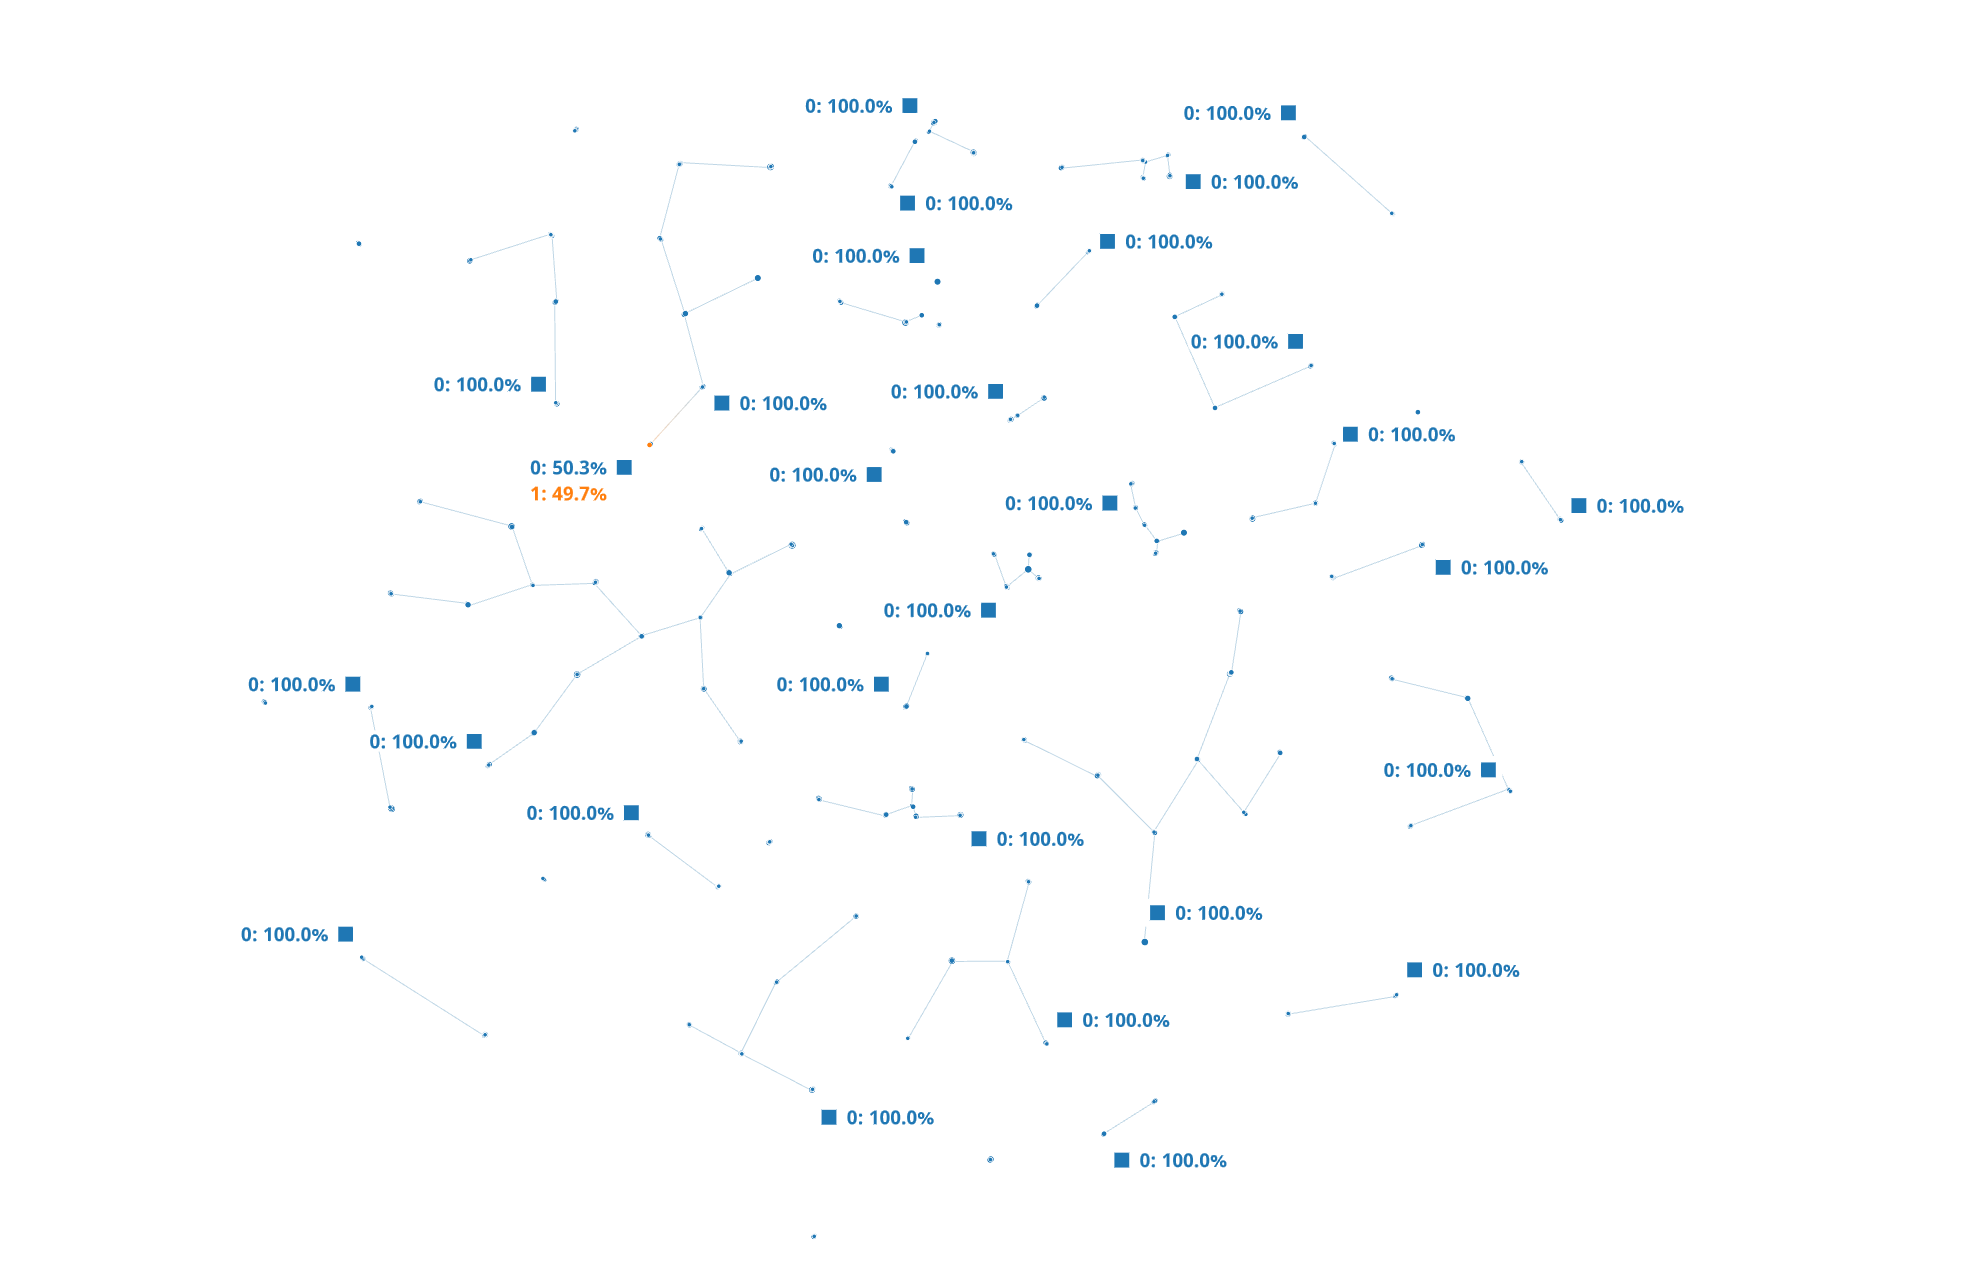
On overlaying the 'target' feature values we can clearly see in Figure 7 that 100% of the failed wafers aggregate into one cluster. We also identified the topmost contributing feature for the observed data separation.
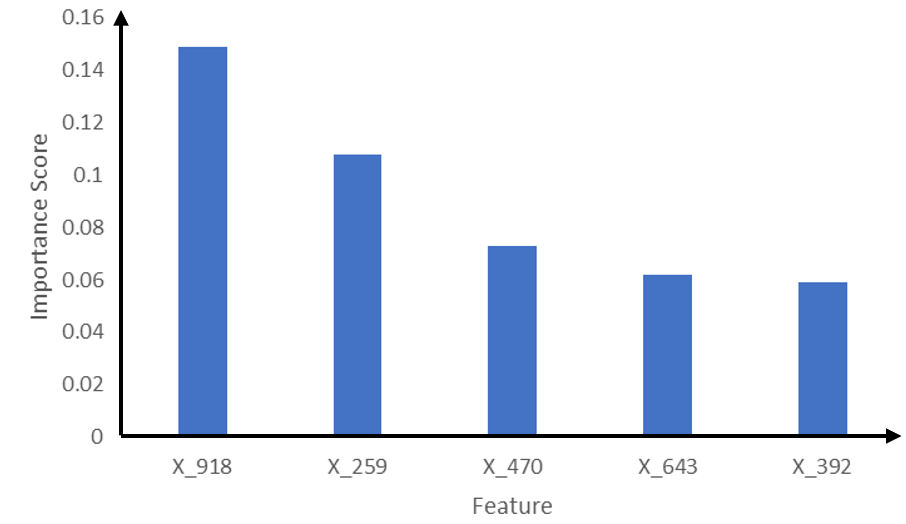
On further zooming into the 'target' cluster, we were able to determine the specific features and their combinations that were resulting into the clustering which were X_101, X_156, X_517, X_452, X_679 etc. To determine which features of these identified as relevant for the overall TDA map are important to the outcome i.e., failed vs normal wafer, we further applied supervised machine learning method CatBoost which is an open- source library that uses gradient boosting on decision trees [4] for both regression and classification tasks. The feature selected as important for the outcome are shown in Figure 8. These features were further confirmed to be important by the respective process owners as top contributors to the observed failures.
Use case 2
The second use case that we investigated using this DTDA comprised of 11,468 wafers with 962 process flow steps. Out of this 11k+ wafers, there were 1137 wafers that were failing their metrics. The challenge was to determine out of these 900+ process steps which one was contributing to the failed wafers.
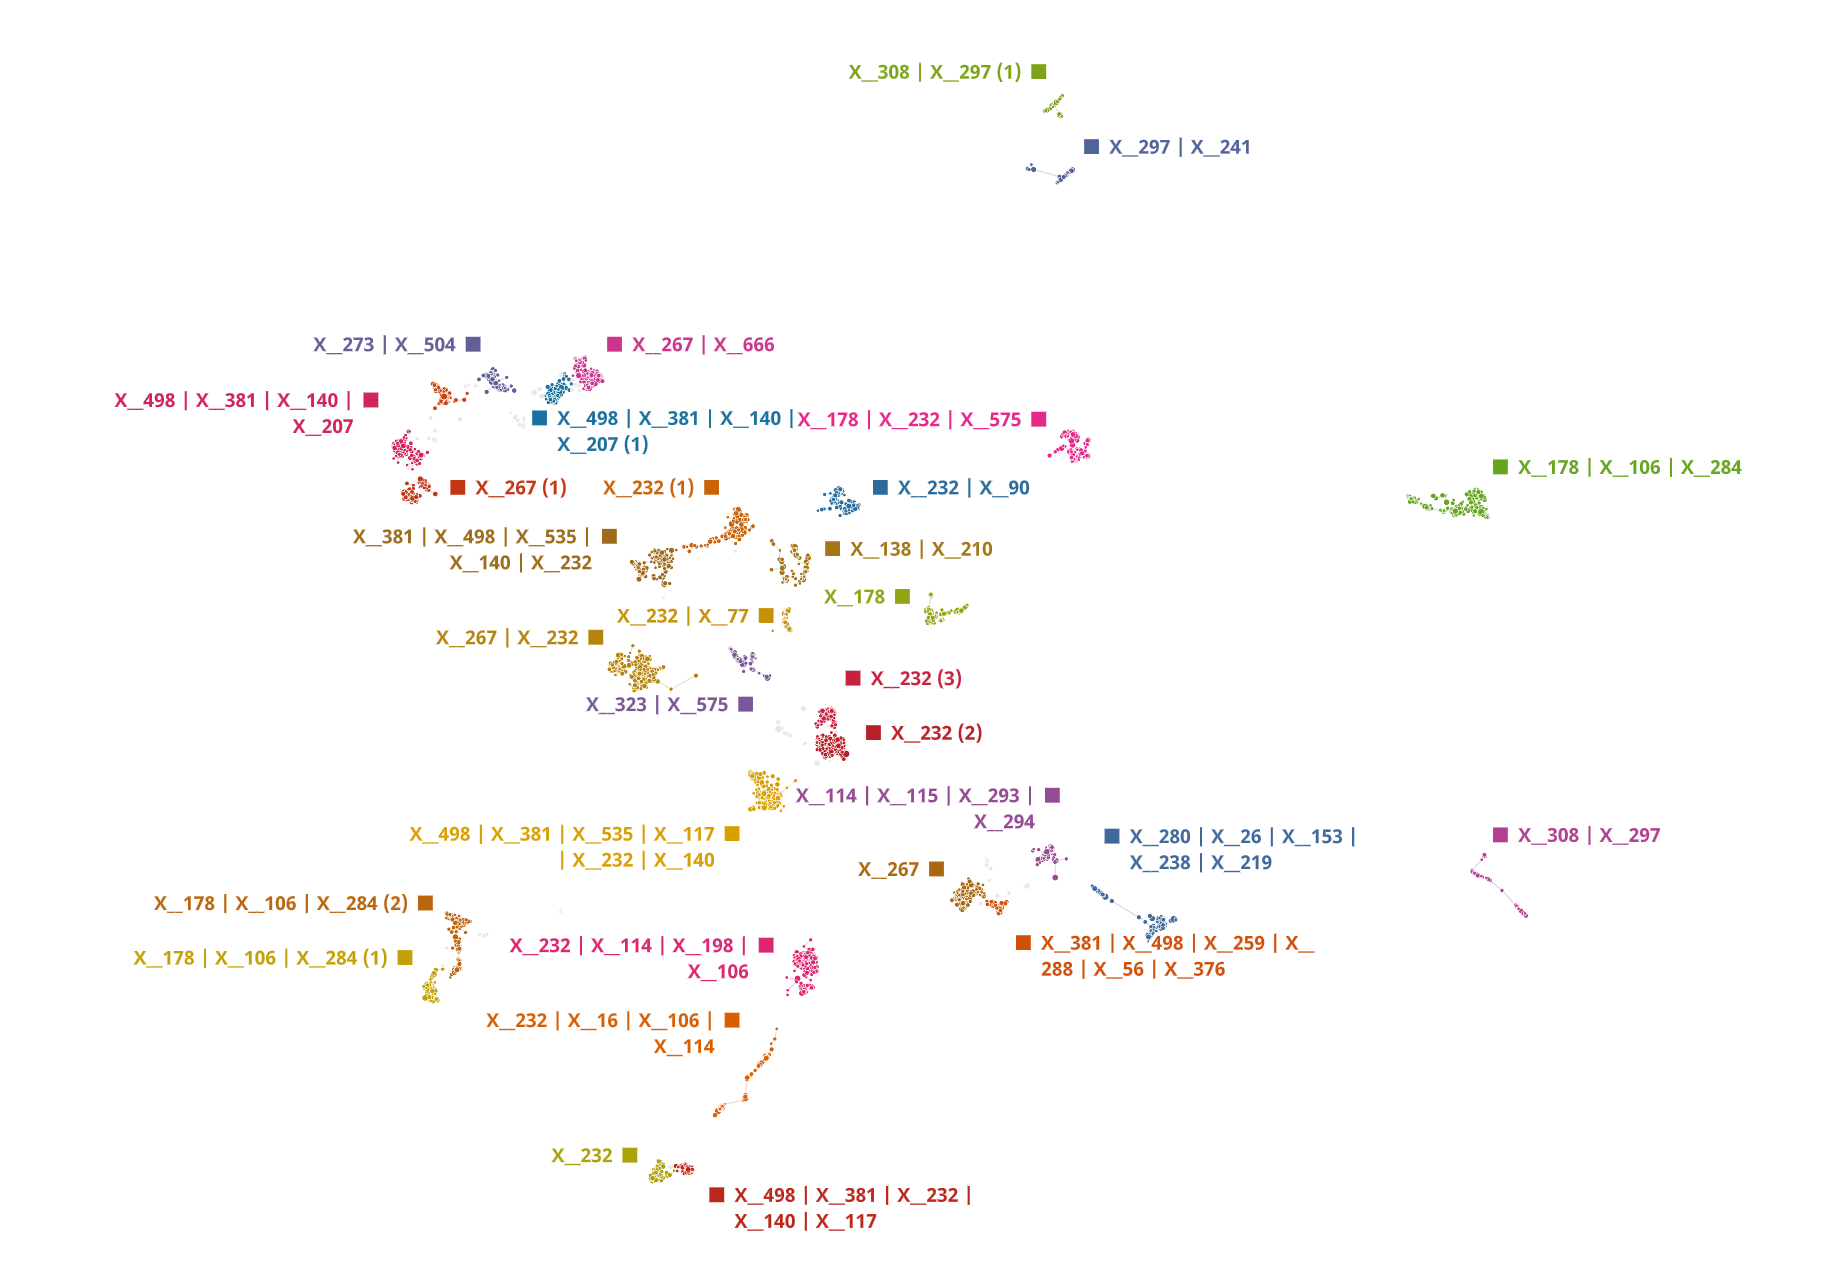
The hypothesis we were testing was same as use case 1 i.e., if the given dataset contained one of specific combination of process flow steps which are contributing to the failure, then we should be able to capture those through DTDA. In Figure 9, the resulting TDA map from the given dataset is shown. Interestingly, when the 'target' values are overlaid on this map in Figure 10 no distinct cluster which is composed of all the failed wafers is found.
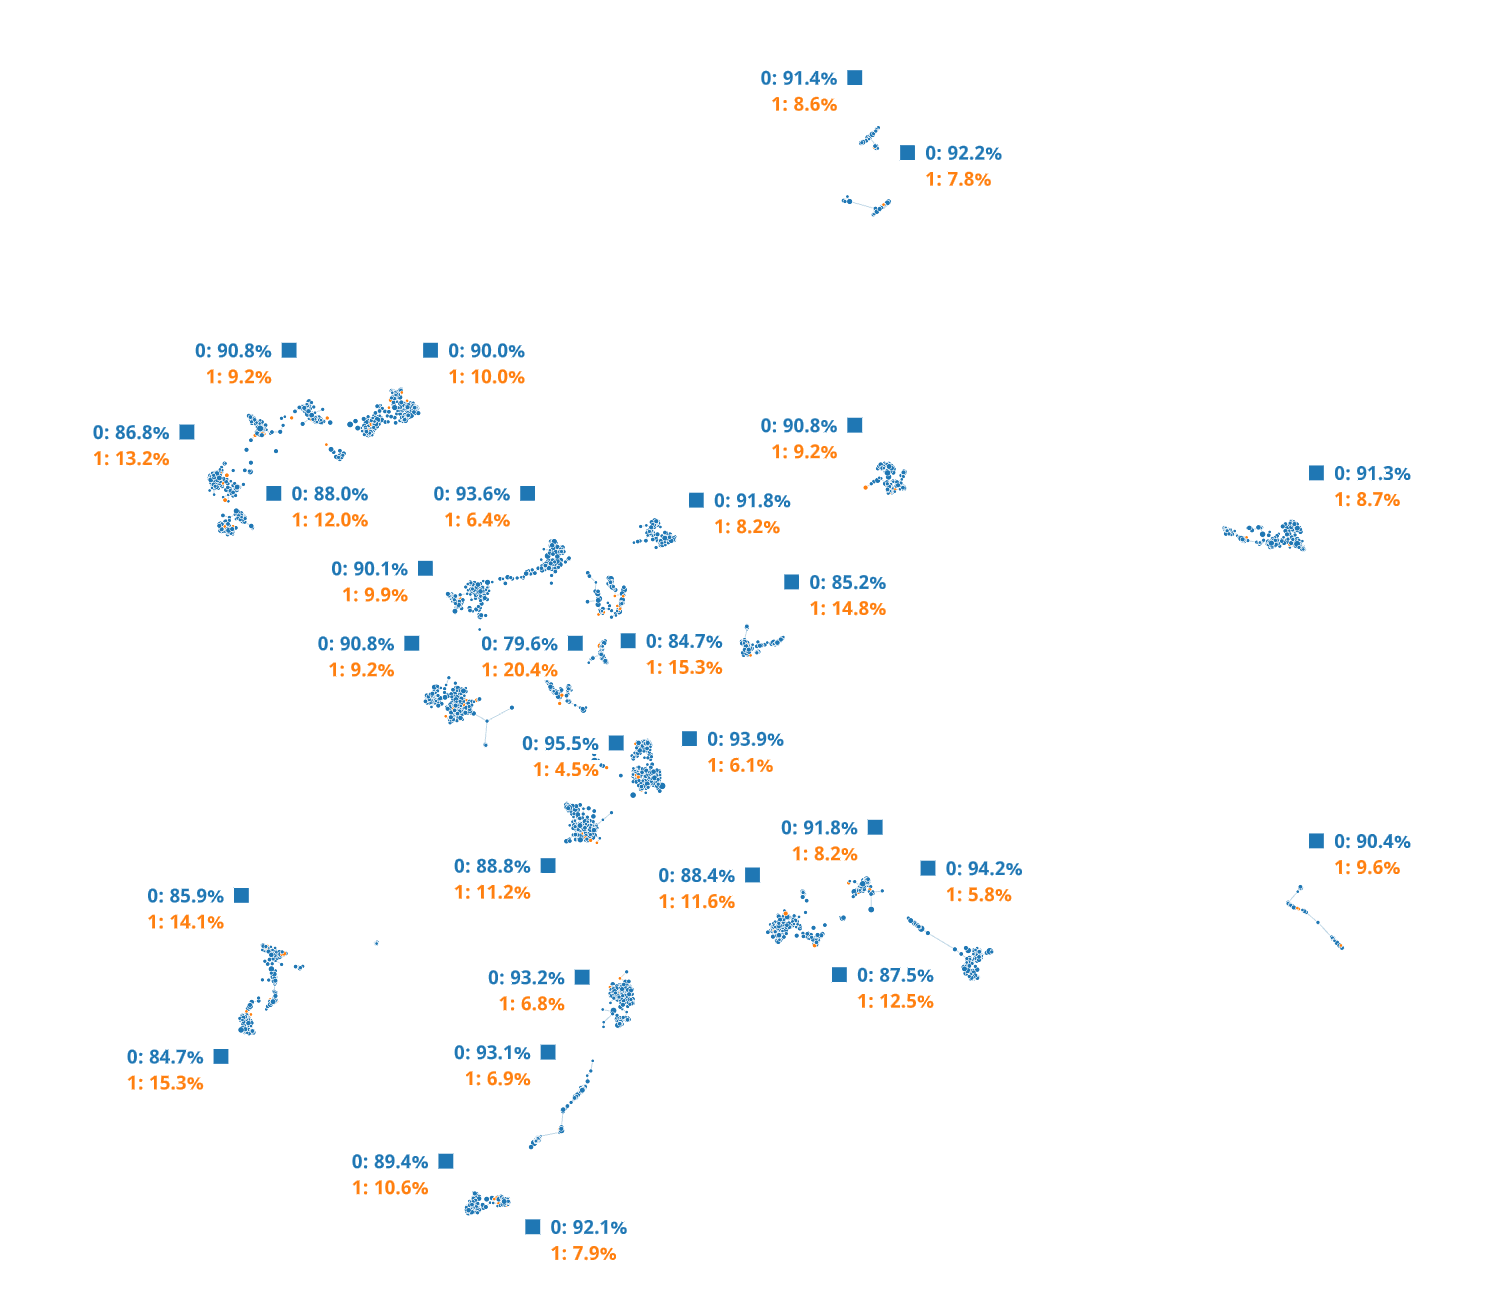
There is an even distribution of the 'target' values as shown in which conveys that the dataset does not contain features that have the strongest impact and thus, fail to explain the observed wafer failures. Thus, to determine what part of the manufacturing flow resulted in these failures it needs to examine if the dataset is complete or additional data collection is required. Nevertheless, with this approach we were able to visualize the various segments of the dataset and how the 'target' values were distributed in those segments which would not have been possible otherwise with the classical approaches.
Conclusion
Semiconductor manufacturing is a long and complex manufacturing process through which silicon wafers are turned into electronic devices. Considering the complexity and the enormous amount of data that the manufacturing process generates, it has been becoming increasingly challenging to determine the root cause of failures. The wafer manufacturing yield and quality are significantly impacted if a single or combination of those process steps malfunction. In semiconductor manufacturing we are thus, posed with a high dimensional data problem where the datasets could have more features than the samples especially during the new product introduction phase where limited wafers are available. As a result, these datasets could be extremely imbalanced, and at times sparse. In such a situation, classical and established AI/ML approaches turn out to be ineffective in identifying the root causes for yield and quality improvement.
Deep Topological Data Analysis (DTDA) an unsupervised machine learning comes to rescue with its unique capability to extract useful patterns and determine relevant features from such high dimensional datasets. We have successfully demonstrated how our proposed framework based on DataRefiner's DTDA engine enabled our yield & quality teams to conduct data mining, visualization, and predictive modeling for their high dimensional, sparse, and extremely imbalanced datasets. The discussed approach is applicable to structured data i.e., in form of rows and columns.
References
[1] G. Carlsson, "Topology and data," Bull. Amer. Math. Soc, vol. 46, no. 2, pp. 255-308, 2009
[2] L. Wasserman, "Topological data analysis," Ann. Rev. Stat. Appl, vol. 5, pp. 501-532, 2018.
[3] R. G. ,. a. E. M. G. R. Pedro Espadinha-Cruz, "A Review of Data Mining Applications in Semiconductor Manufacturing," Processes, vol. 9, no. 305, 2021.
[4] L. G. G. V. A. D. A. V. &. G. A. Prokhorenkova, "CatBoost: unbiased boosting with categorical features," arXiv preprint, 2019.