
Cutting-edge image clusterization using Topological Data Analysis
DataRefiner introduces a cutting-edge model that pushes the boundaries of unsupervised image clustering
Image clusterization process using DataRefiner
The Significance of Unsupervised Image Clustering
In today's data-driven world, the ability to make sense of vast amounts of image data is paramount for various industries. Unsupervised image clustering emerges as a crucial technique, offering businesses the capability to organize, understand, and derive insights from their visual data without the need for labeled examples.
Unsupervised image clustering, a subset of unsupervised learning, involves grouping similar images together based on their inherent characteristics, without any predefined labels. This process is instrumental in several areas:

- Quality Control in Manufacturing: Manufacturers can employ unsupervised image clustering to inspect product defects, identify anomalies in production lines, and streamline quality control processes for enhanced product reliability and customer satisfaction.
- E-commerce Product Segmentation: By clustering product images based on visual similarities, e-commerce platforms can enhance user experience through more accurate product recommendations and personalized marketing strategies.
- Medical Image Analysis: Healthcare providers can utilize unsupervised image clustering to categorize medical images such as X-rays, MRIs, and CT scans, aiding in disease diagnosis, treatment planning, and patient monitoring.
- Automotive Safety and Navigation: In the automotive industry, clustering of traffic and road images aids in developing advanced driver assistance systems (ADAS) for improved safety, autonomous vehicle navigation, and traffic management.
- Retail Shelf Monitoring: Retailers can employ image clustering to analyze shelf layouts, identify product placement patterns, and optimize inventory management strategies to improve product visibility and sales.
- Social Media Content Moderation: Social media platforms leverage unsupervised clustering to automatically group similar images for content moderation purposes, facilitating the detection and removal of inappropriate or harmful content.
- Satellite Image Interpretation: Organizations involved in agriculture, urban planning, and environmental monitoring can benefit from unsupervised clustering to analyze satellite images for land use classification, crop monitoring, and disaster response planning.
Comparison with popular approaches: t-SNE and UMAP
All visualizations presented in this article are conducted using unsupervised methods unless otherwise specified.
MNIST
MNIST dataset is a collection of 28x28 pixel grayscale images of handwritten digits (0-9), widely used in machine learning. It consists of 60,000 training images and 10,000 testing images. For this example we merge both train and test datasets together.
Let's compare the visualisation using a number of different approaches: t-SNE, UMAP and Toplogical Data Analysis (TDA):
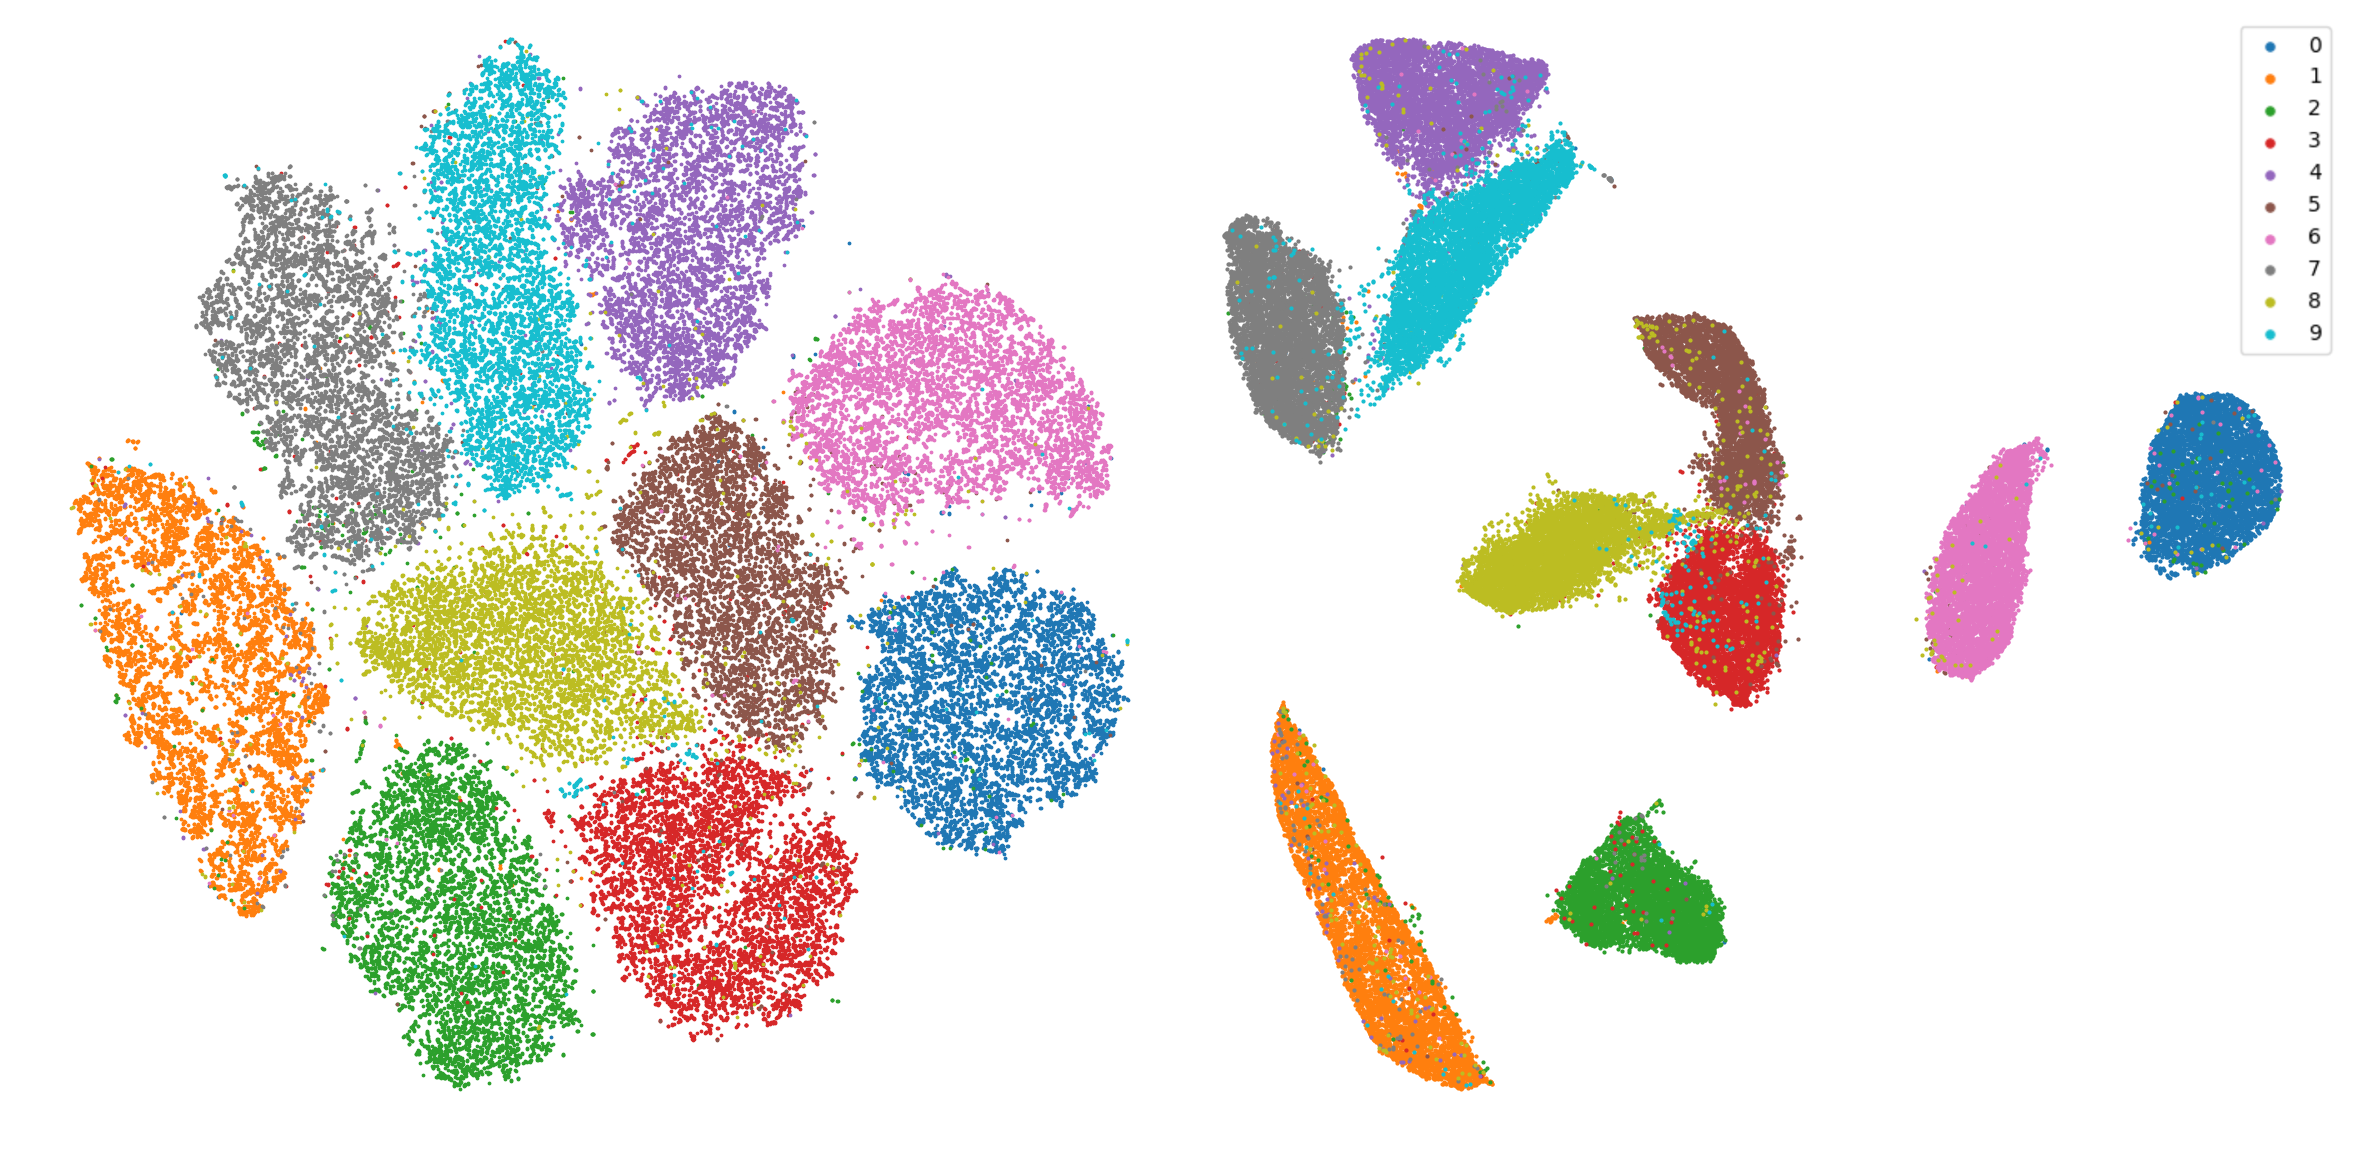
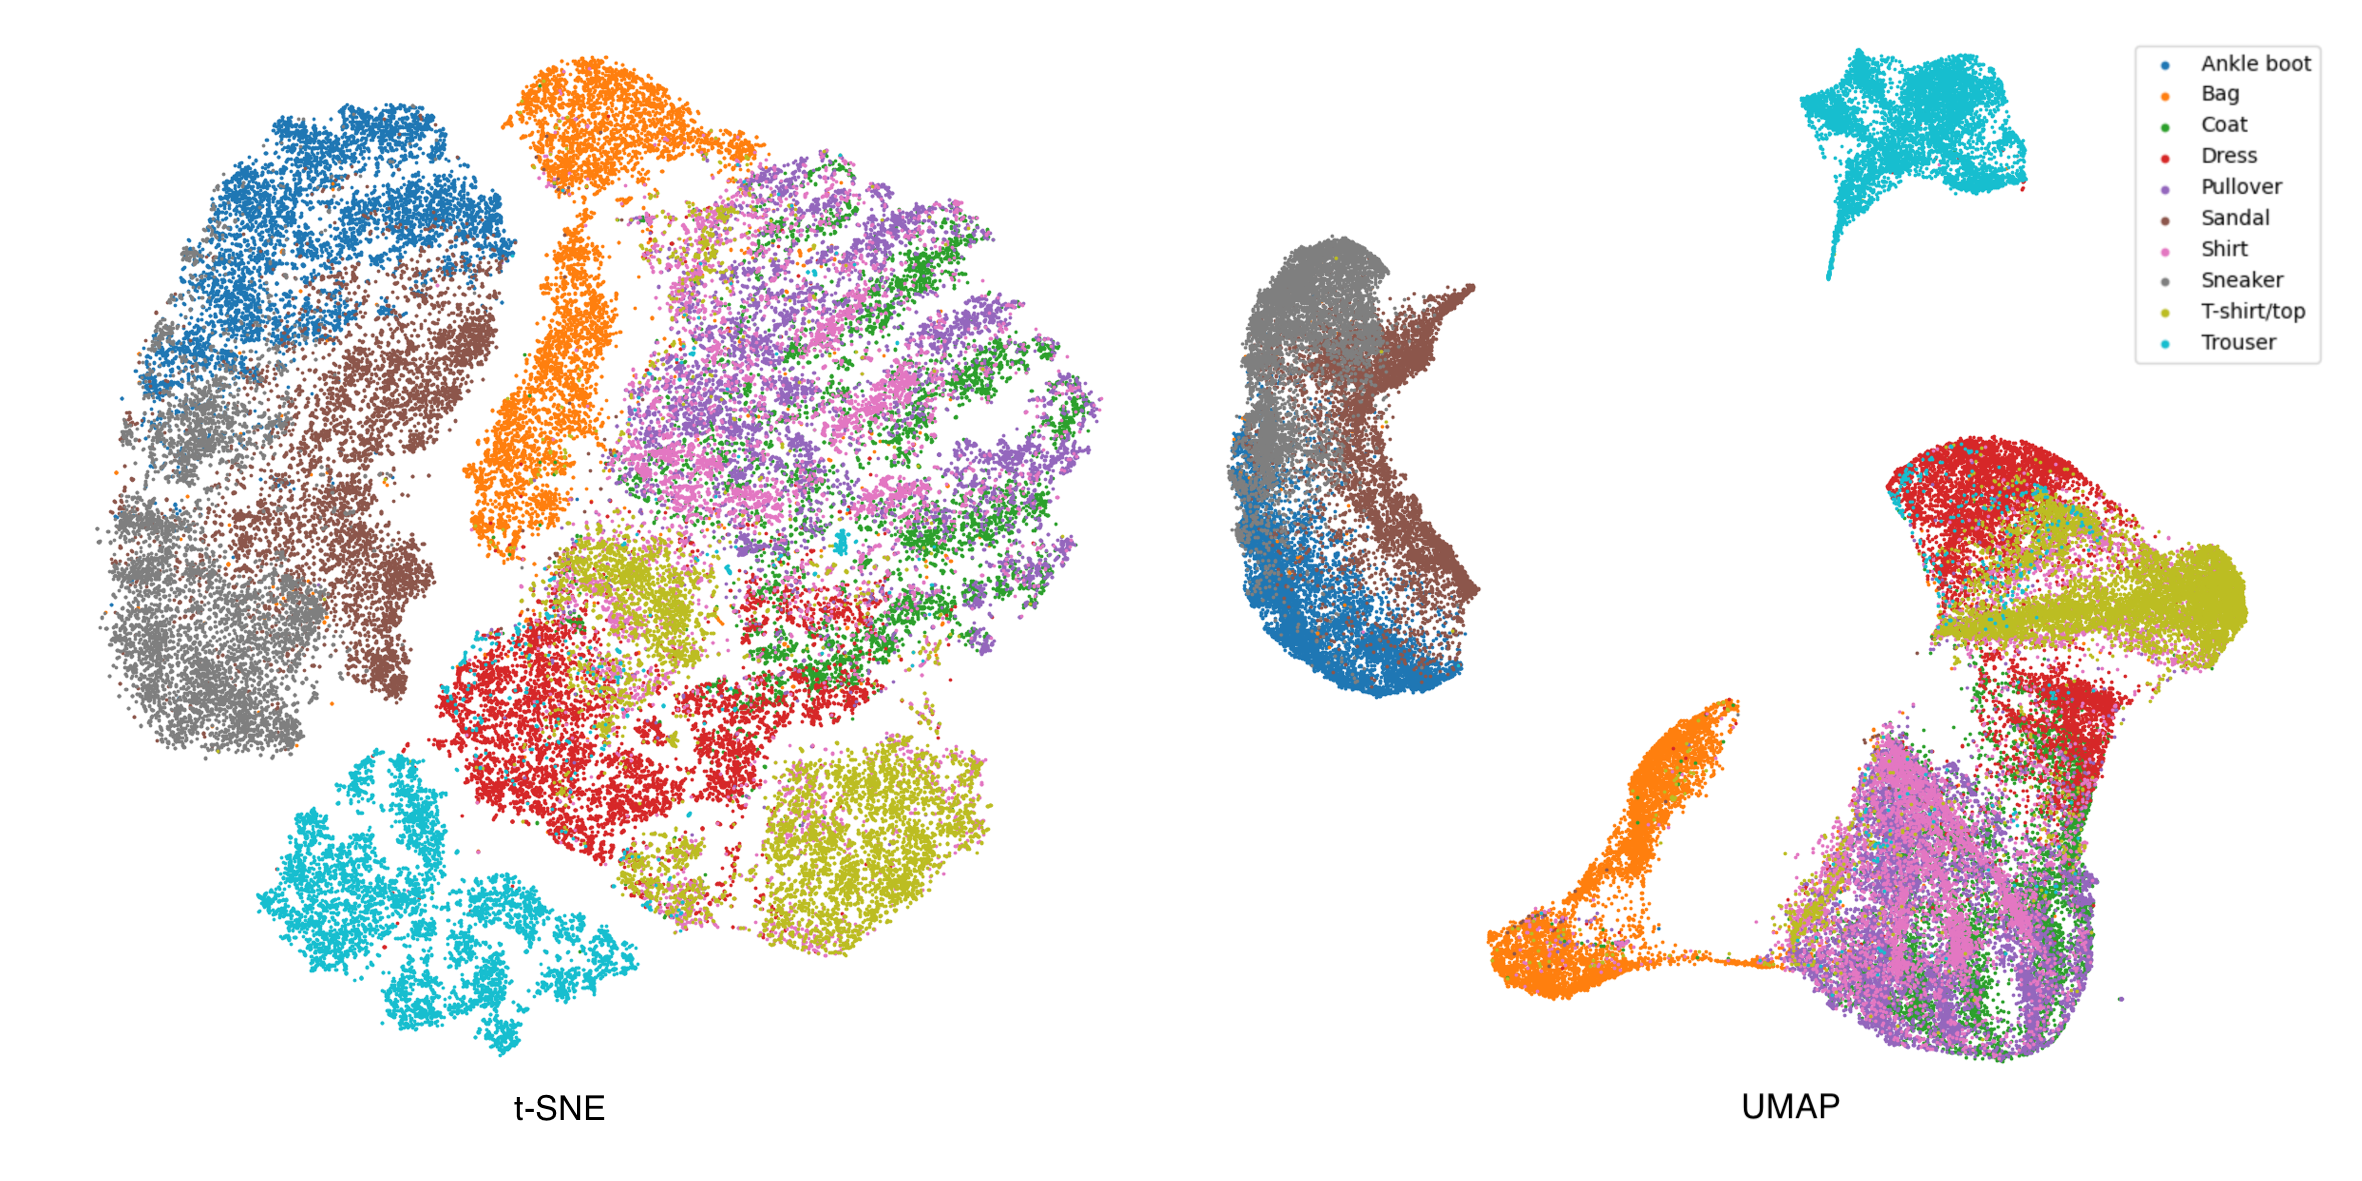
While UMAP successfully identified the ten target clusters, three appear almost merged, hindering clear separation. Additionally, UMAP's results exhibit a significant level of noise within clusters.
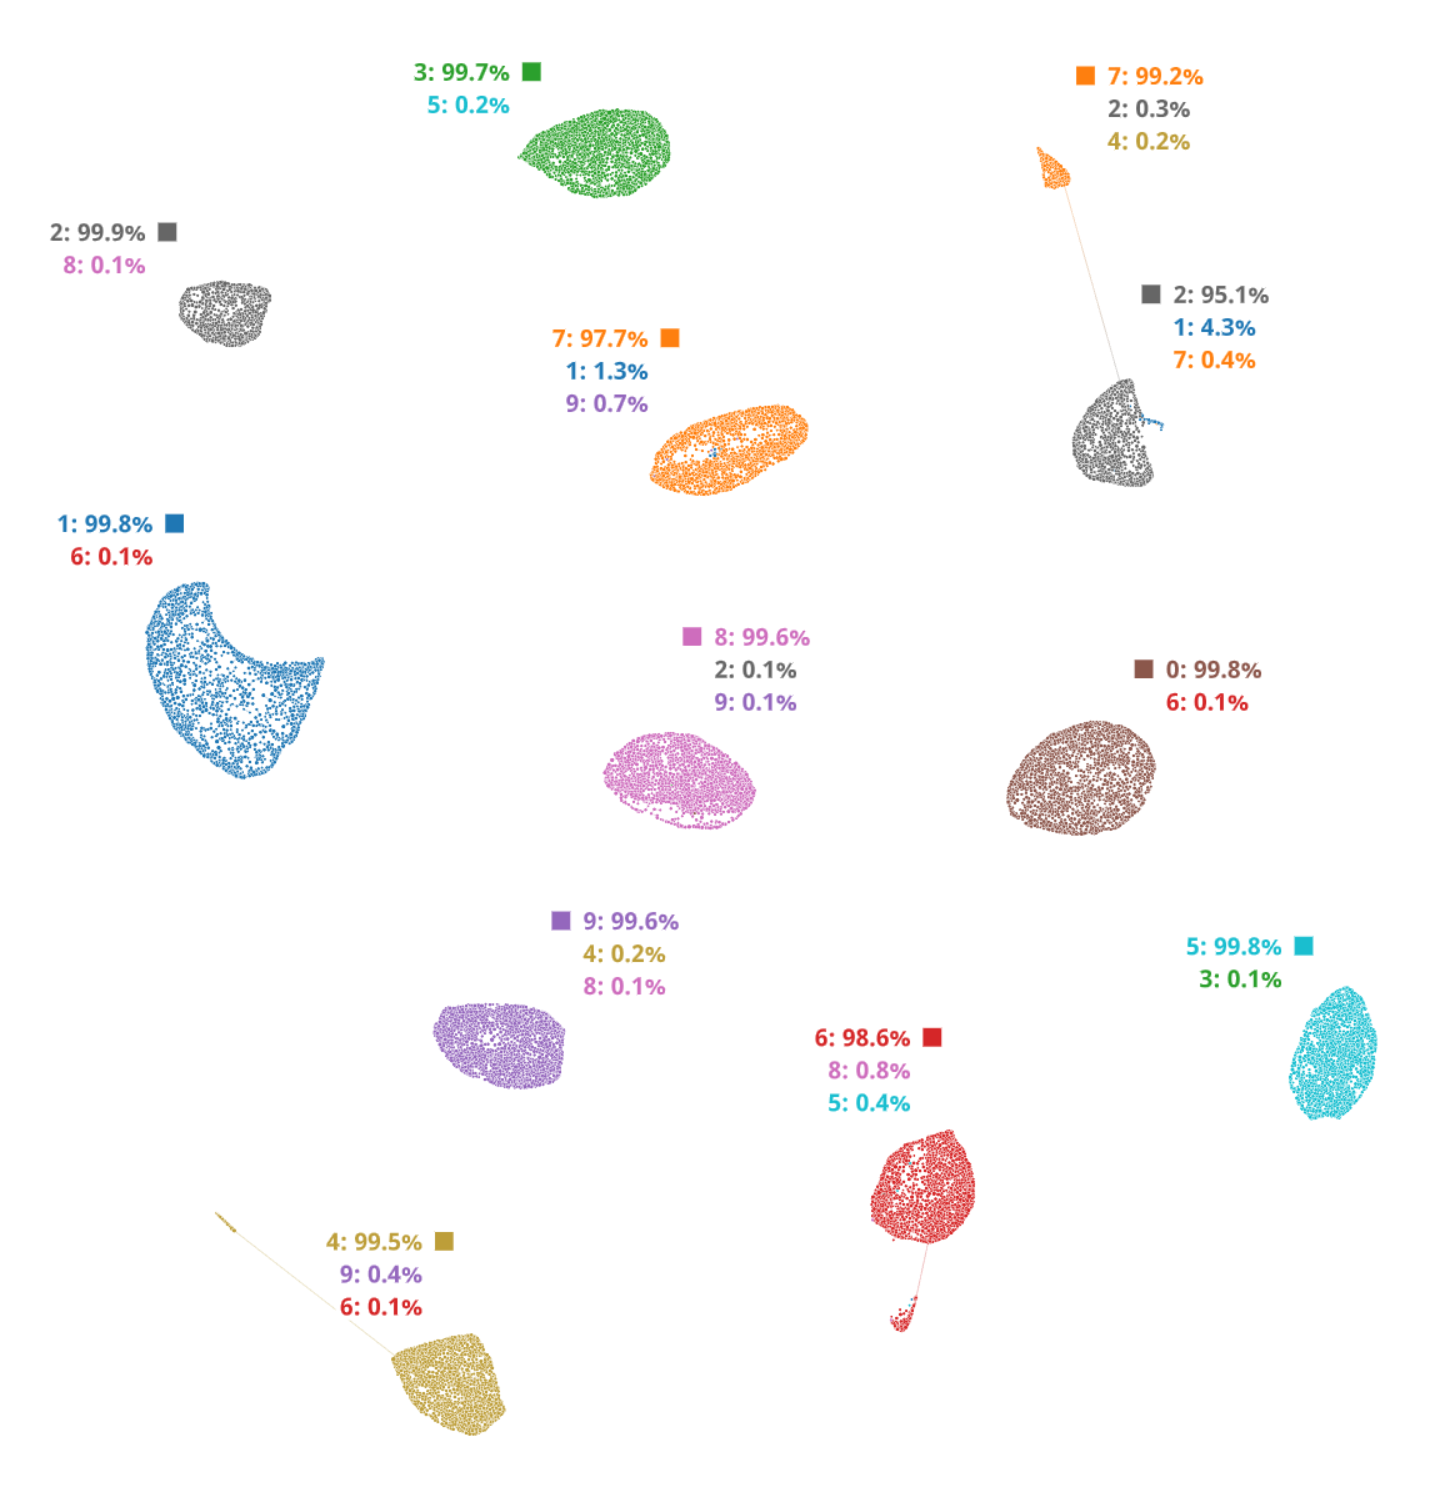
In stark contrast, TDA excels at image segmentation. It achieves an impressive 99.5% to 99.9% purity within its clusters, meaning that nearly all samples from the same class reside together. Visualizing the original images overlaid on the TDA embedding reveals a key advantage. TDA identifies more than ten clusters because it effectively captures subtle variations in how digits like "4," "6," and "7" are written. This highlights TDA's ability to uncover meaningful patterns beyond just the basic class labels.
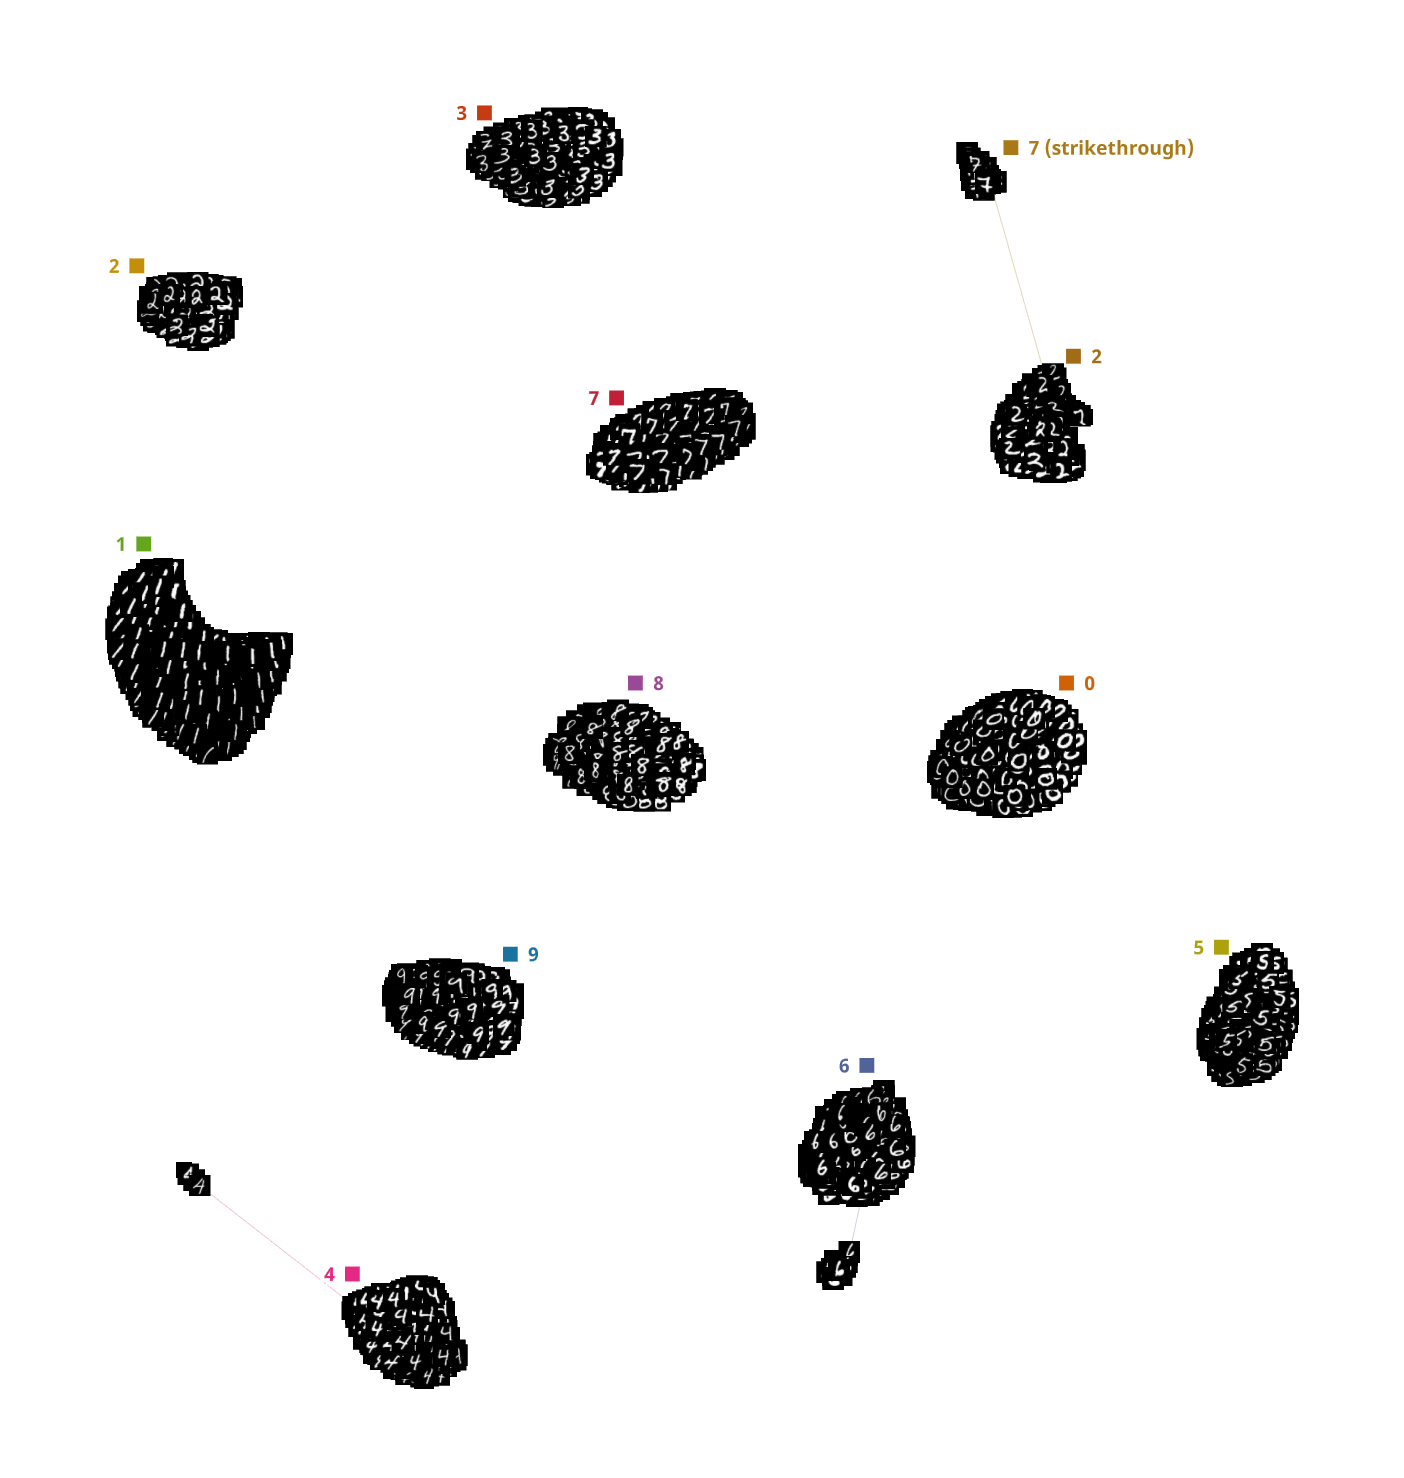
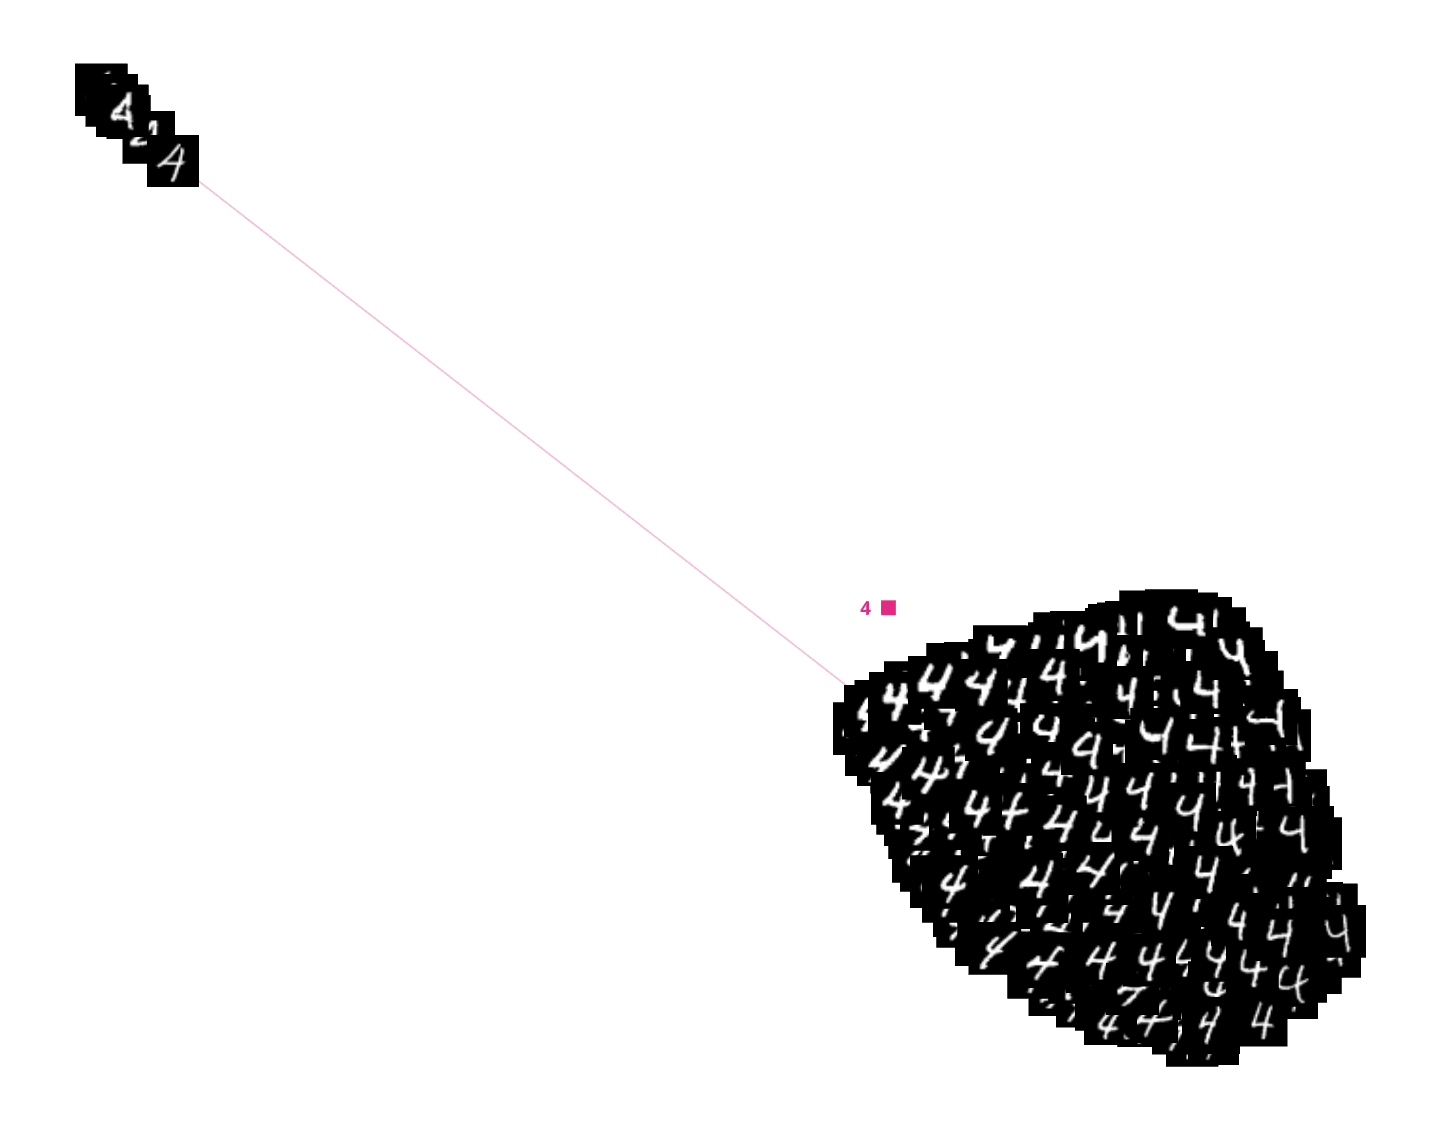
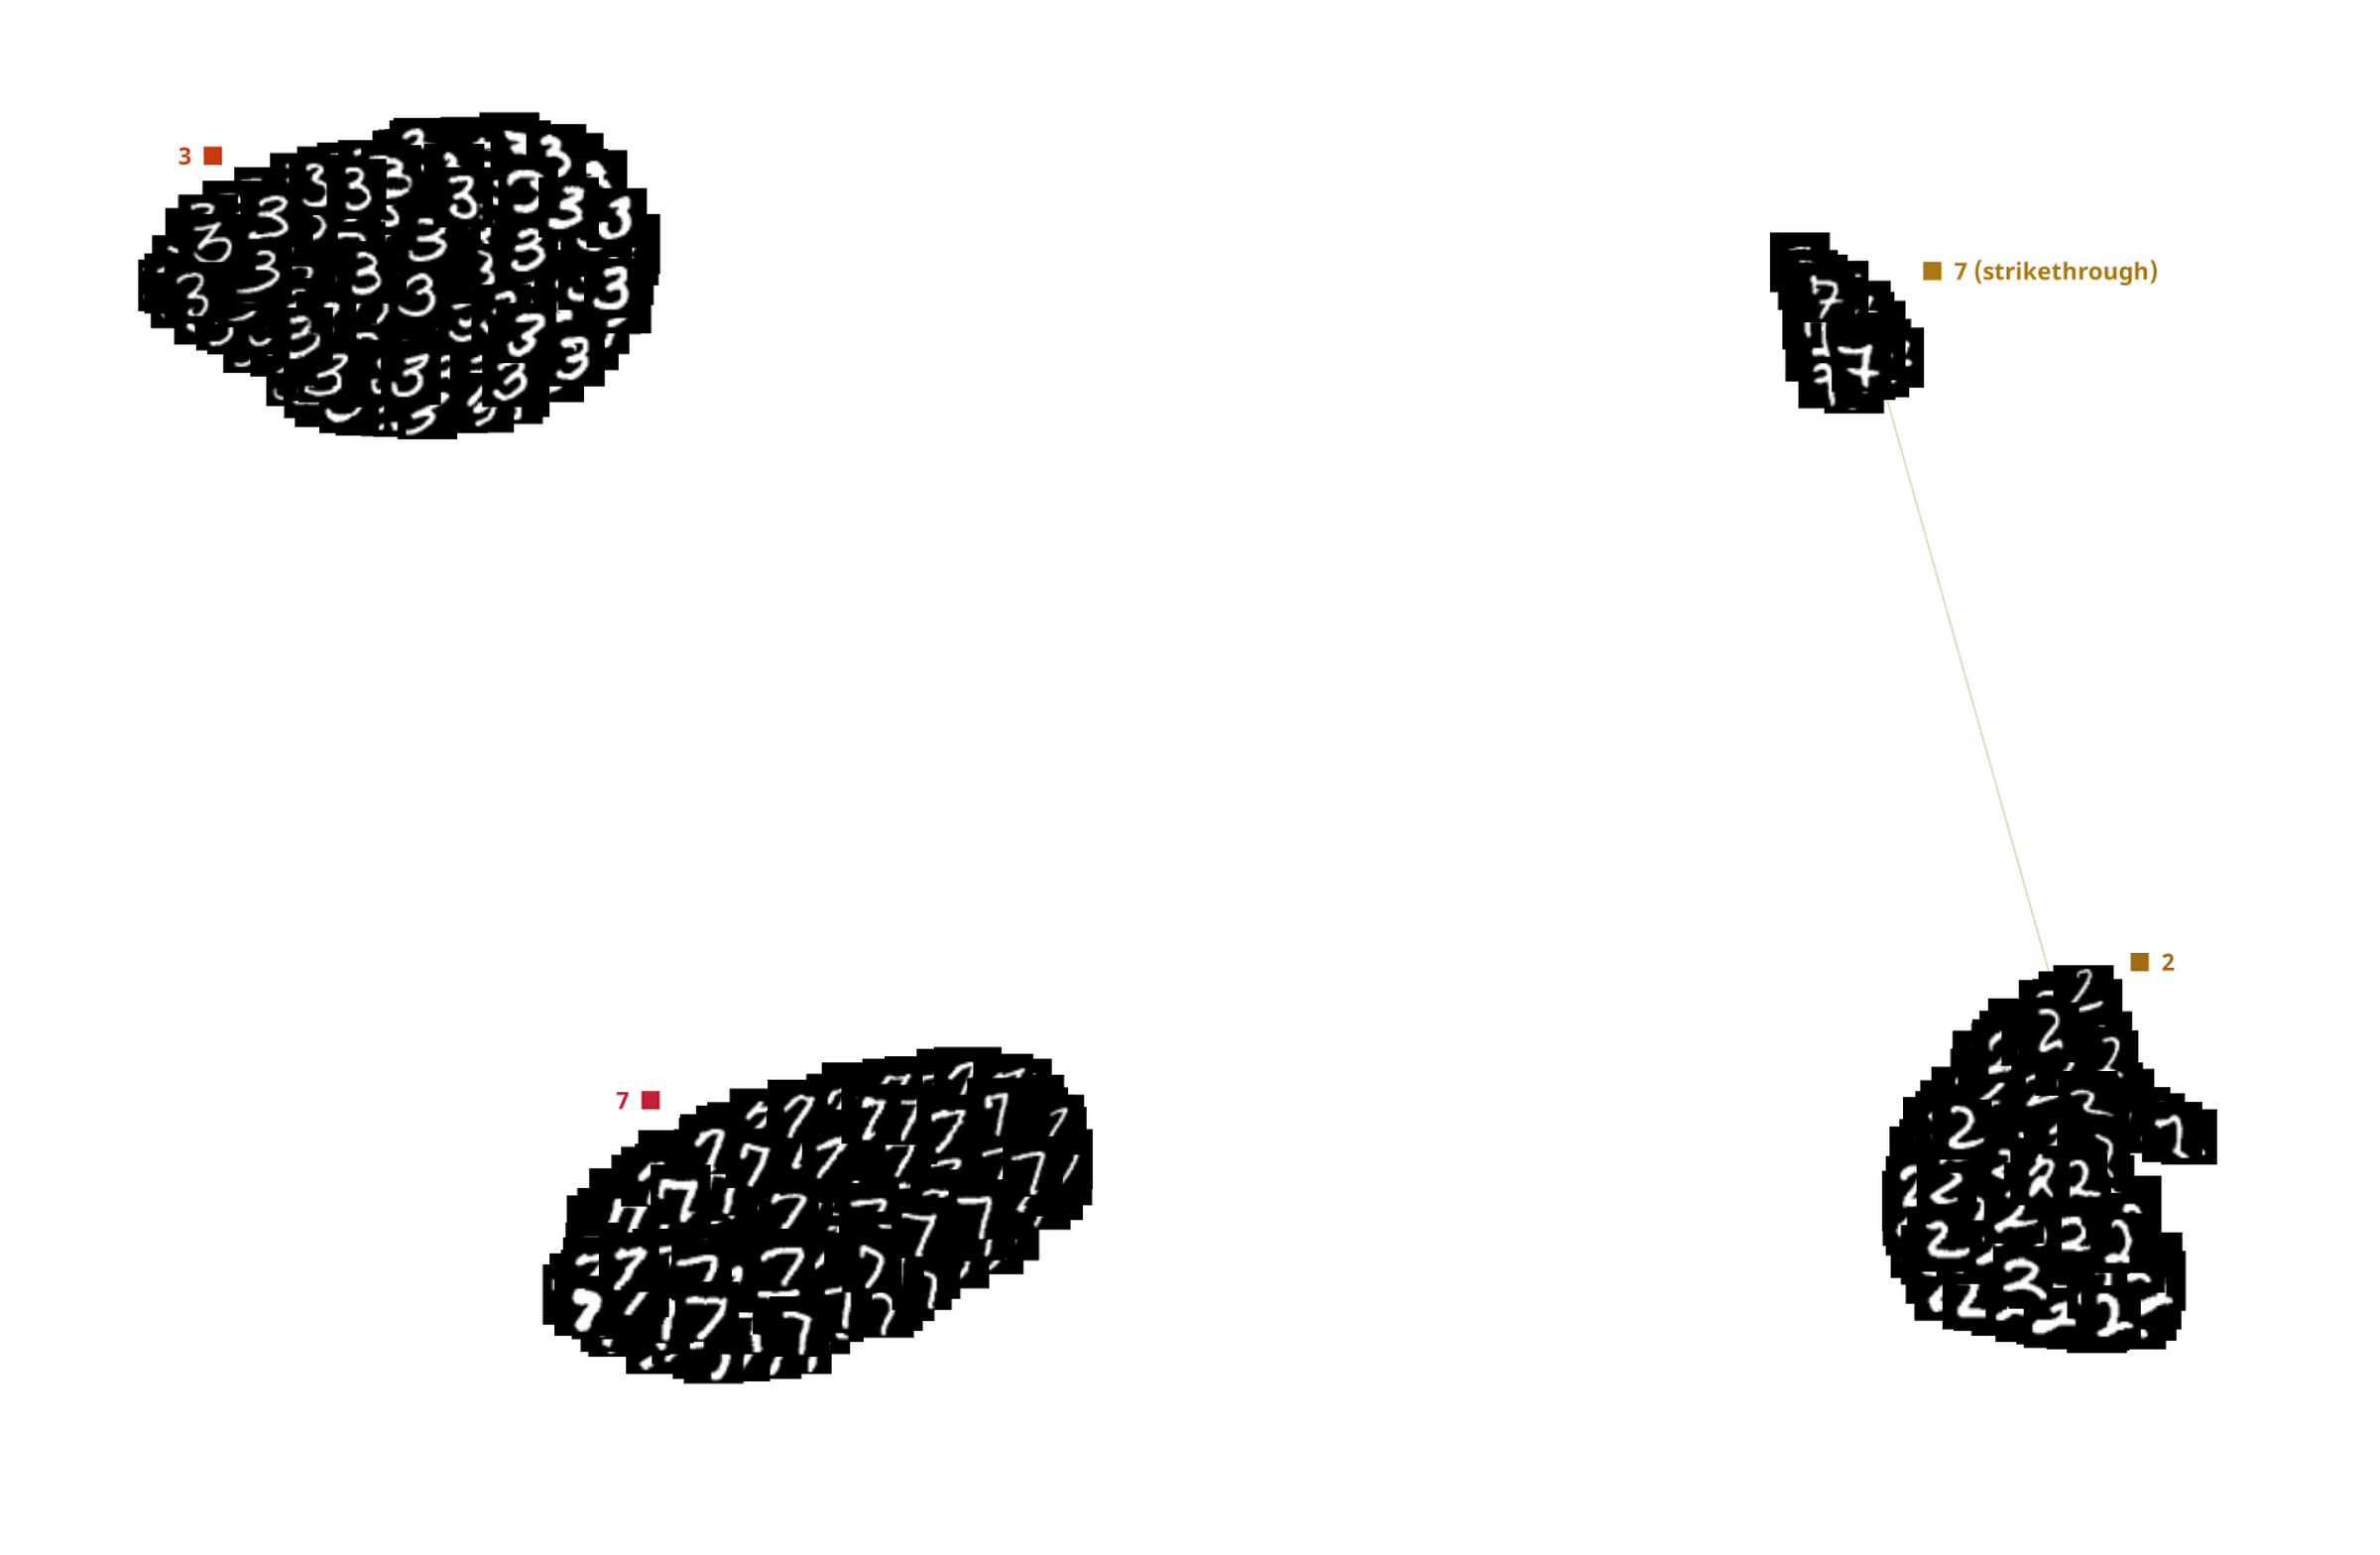
TDA's ability to identify subtle variations shines through in its handling of the digit "4." The model effectively separates two distinct writing styles for "4" into well-defined sub-clusters. Interestingly, TDA even connects these sub-clusters with an edge, signifying their underlying similarity in structure. This example showcases TDA's strength in uncovering nuanced patterns within a single class label.
While TDA achieves exceptional accuracy, it's important to acknowledge and learn from edge cases. Here, we see an interesting misclassification: a variant of "7" with a strikethrough was assigned to the "2" cluster. This might be due to the inherent structural similarities between "2" and "7." Notably, the correct cluster containing standard "7"s resides nearby. This example highlights the ongoing challenge of handling highly customized or ambiguous handwritten digits. It also underscores the value of using real-world data sets that contain such variations to train robust models.
To support the visualisations, we performed two quantitative tests:
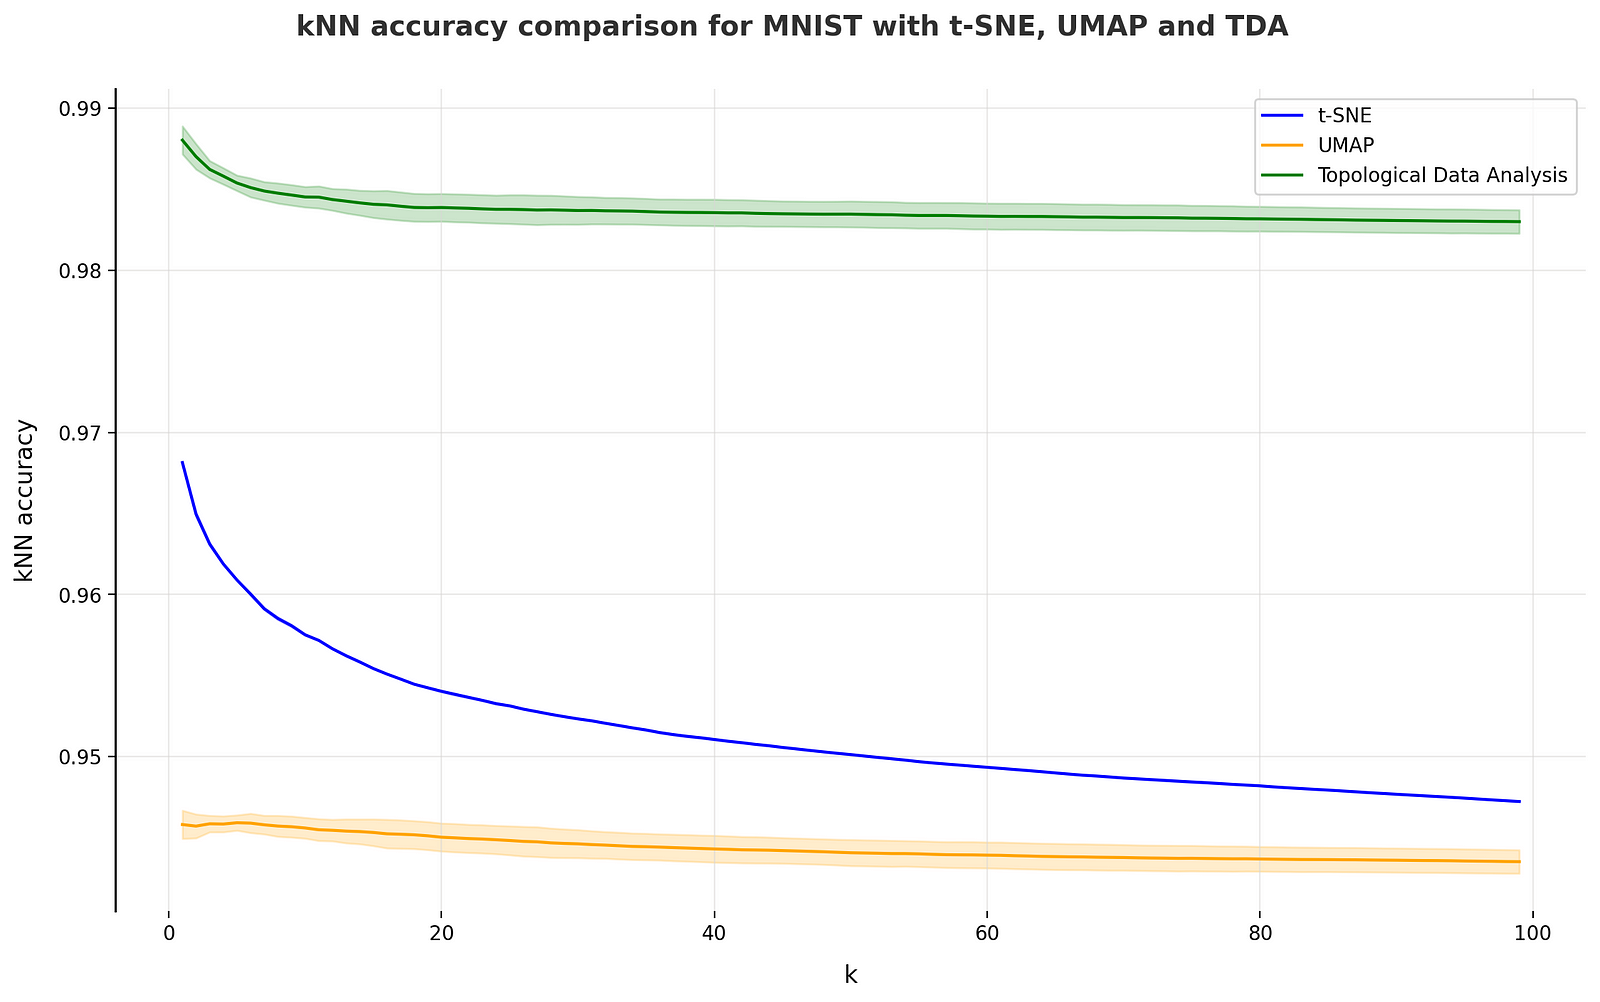
- kNN accuracy: measures the proportion of nearest data points that belong to the same category as the source data point. We perform the calculations for K values ranging from 1 to 100.
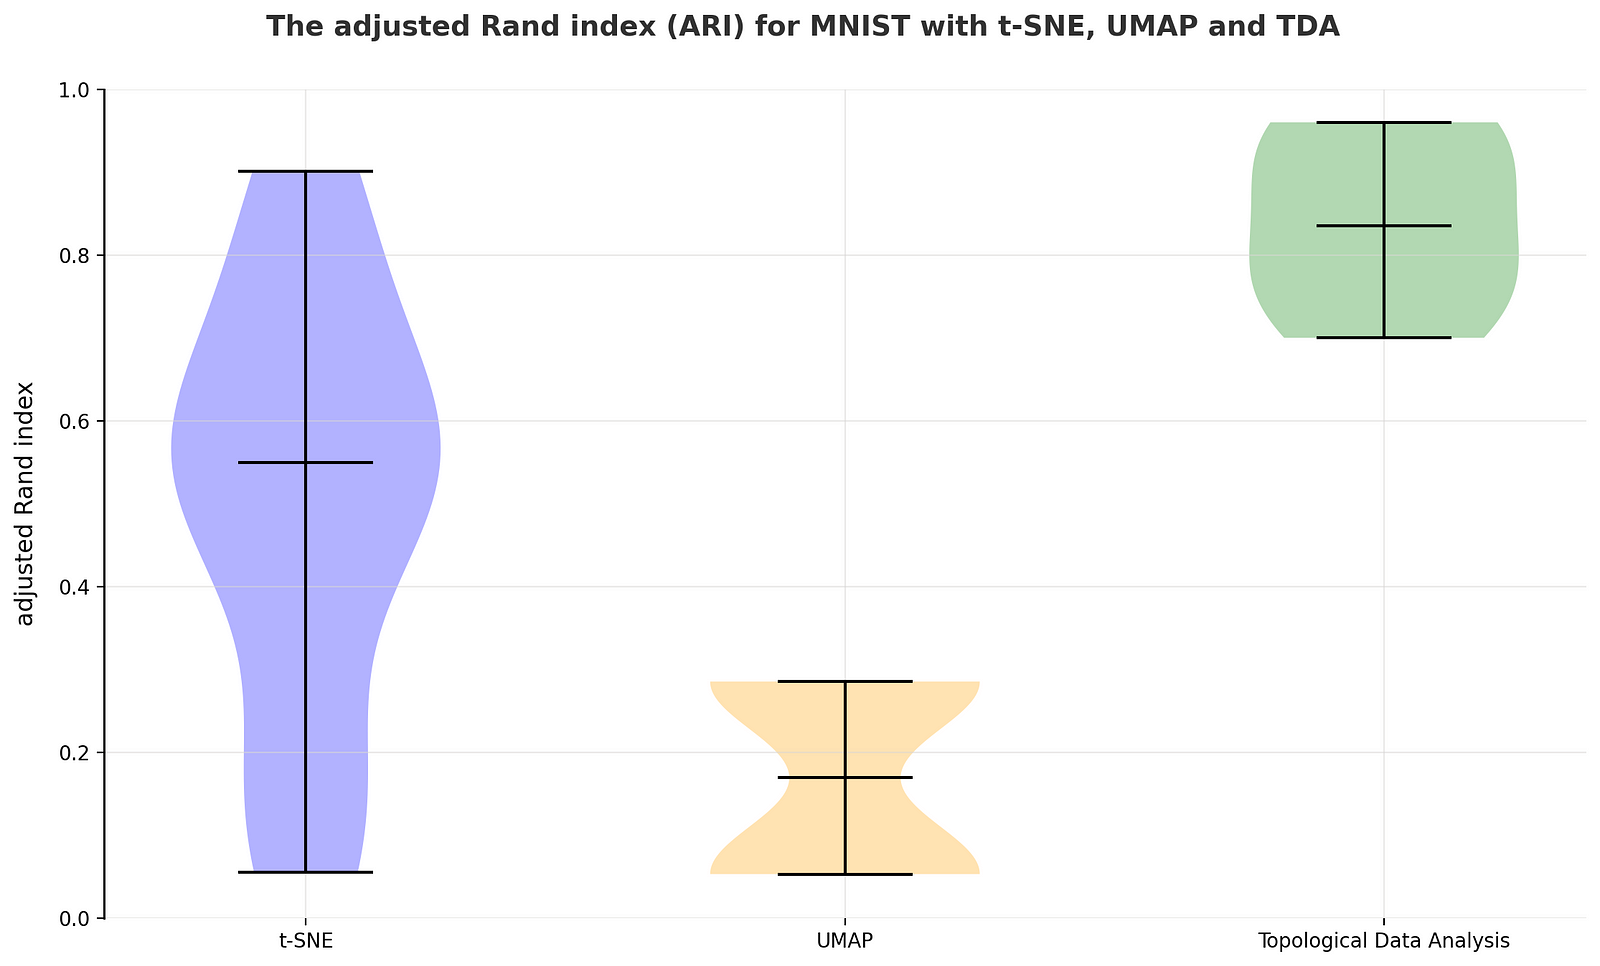
- Adjusted Rand index (ARI): quantifies the similarity between two data clusterings by comparing the agreement of pairs of data points in their assigned clusters with the agreement that would be expected by chance. ARI ranges from -1 to 1, where higher values indicate better agreement than random chance. To test ARI we perform iterative clustering using DBSCAN with eps = [2, 3] and min_samples = [5, 10, 15, 20, 25, 30, 35, 40, 45, 50], in total 20 clusterization runs are performed.
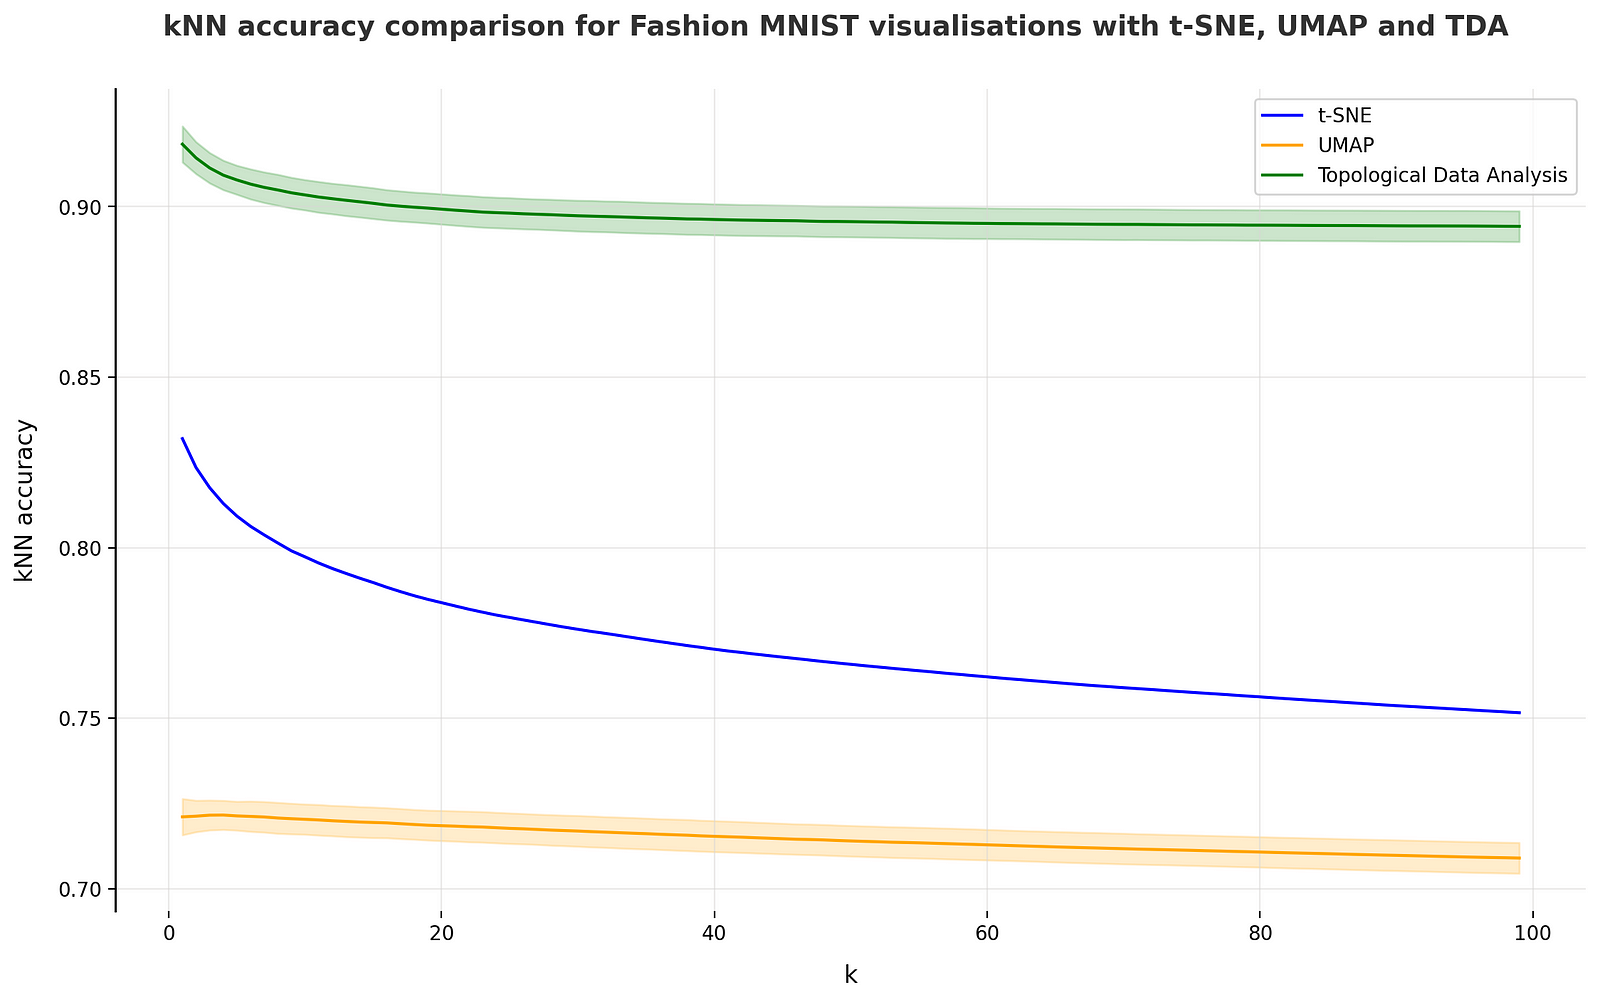
The kNN accuracy graph presents some intriguing findings. While UMAP initially underperforms compared to t-SNE, it's noteworthy that t-SNE's accuracy deteriorates more rapidly as the k value increases. This suggests that UMAP might be more stable in preserving local structure relevant for kNN classification tasks, especially for higher k values.
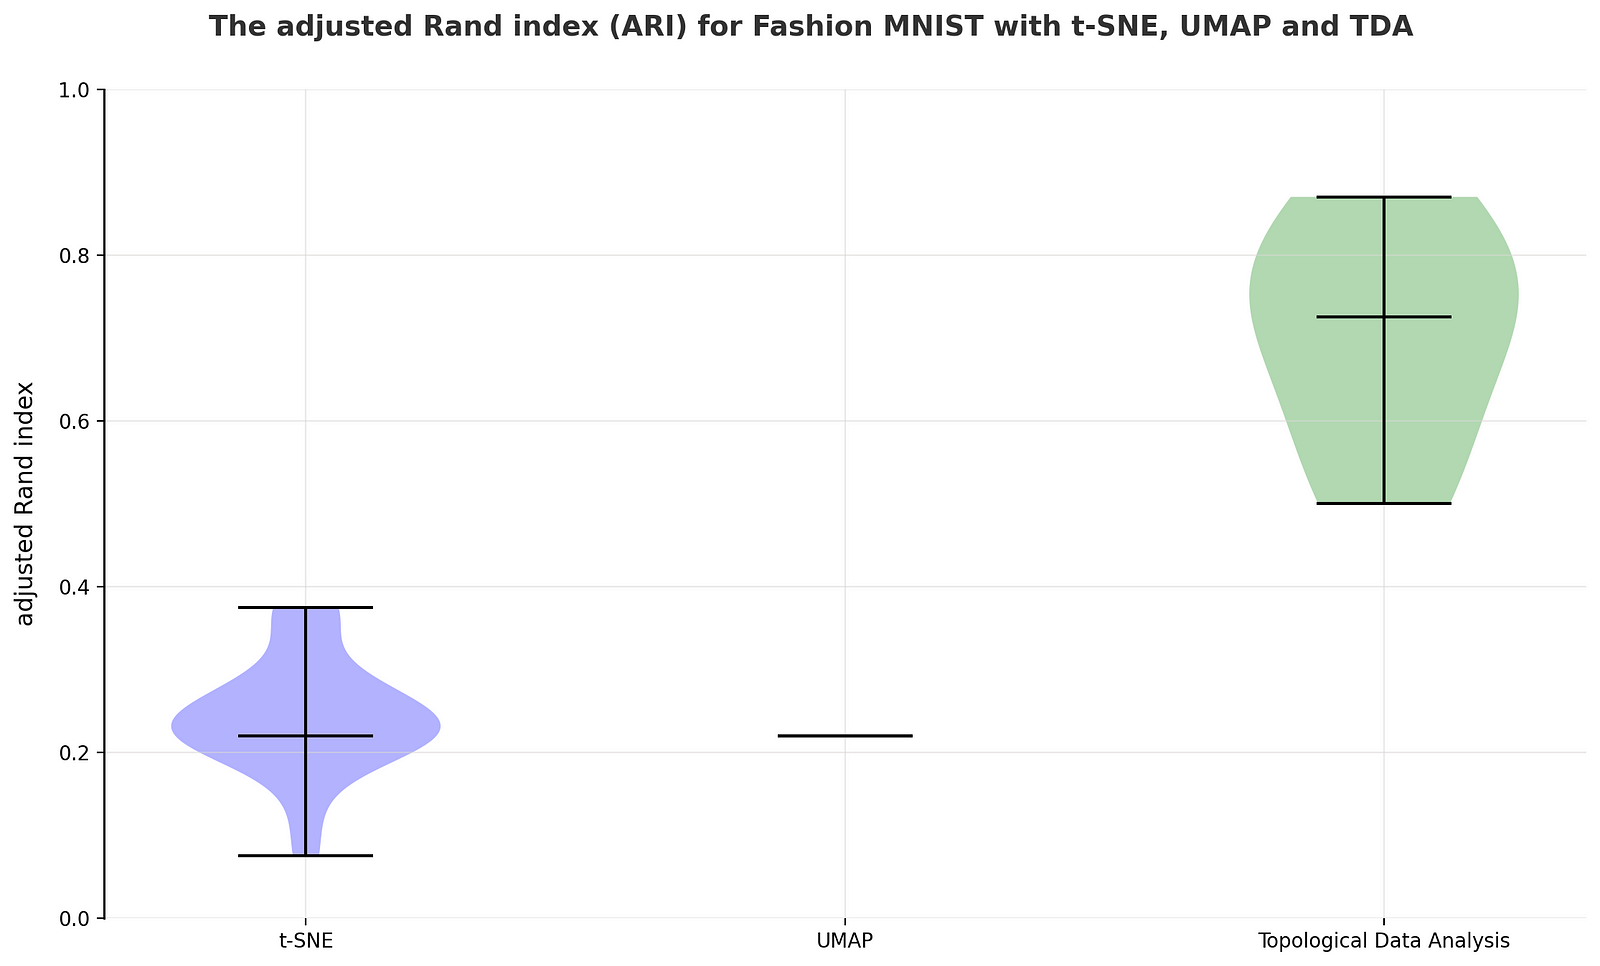
The Adjusted Rand Index (ARI) measures the purity of extracted clusters. Here, t-SNE shows some competitiveness, particularly when DBSCAN parameters are carefully tuned. However, UMAP exhibits lower but more consistent ARI scores. Notably, TDA achieves both exceptional consistency and very high ARI values for this dataset, highlighting its ability to generate consistently pure clusters.
Fashion MNIST
Fashion MNIST is a benchmark dataset in machine learning, consisting of 70,000 grayscale images of clothing items in 10 categories such as t-shirts, trousers, and dresses. Each image is 28x28 pixels, making it smaller and more manageable than the original MNIST dataset. Fashion MNIST serves as a replacement for the handwritten digits of MNIST, offering a more challenging classification task for image recognition models while remaining relatively simple to use and understand.
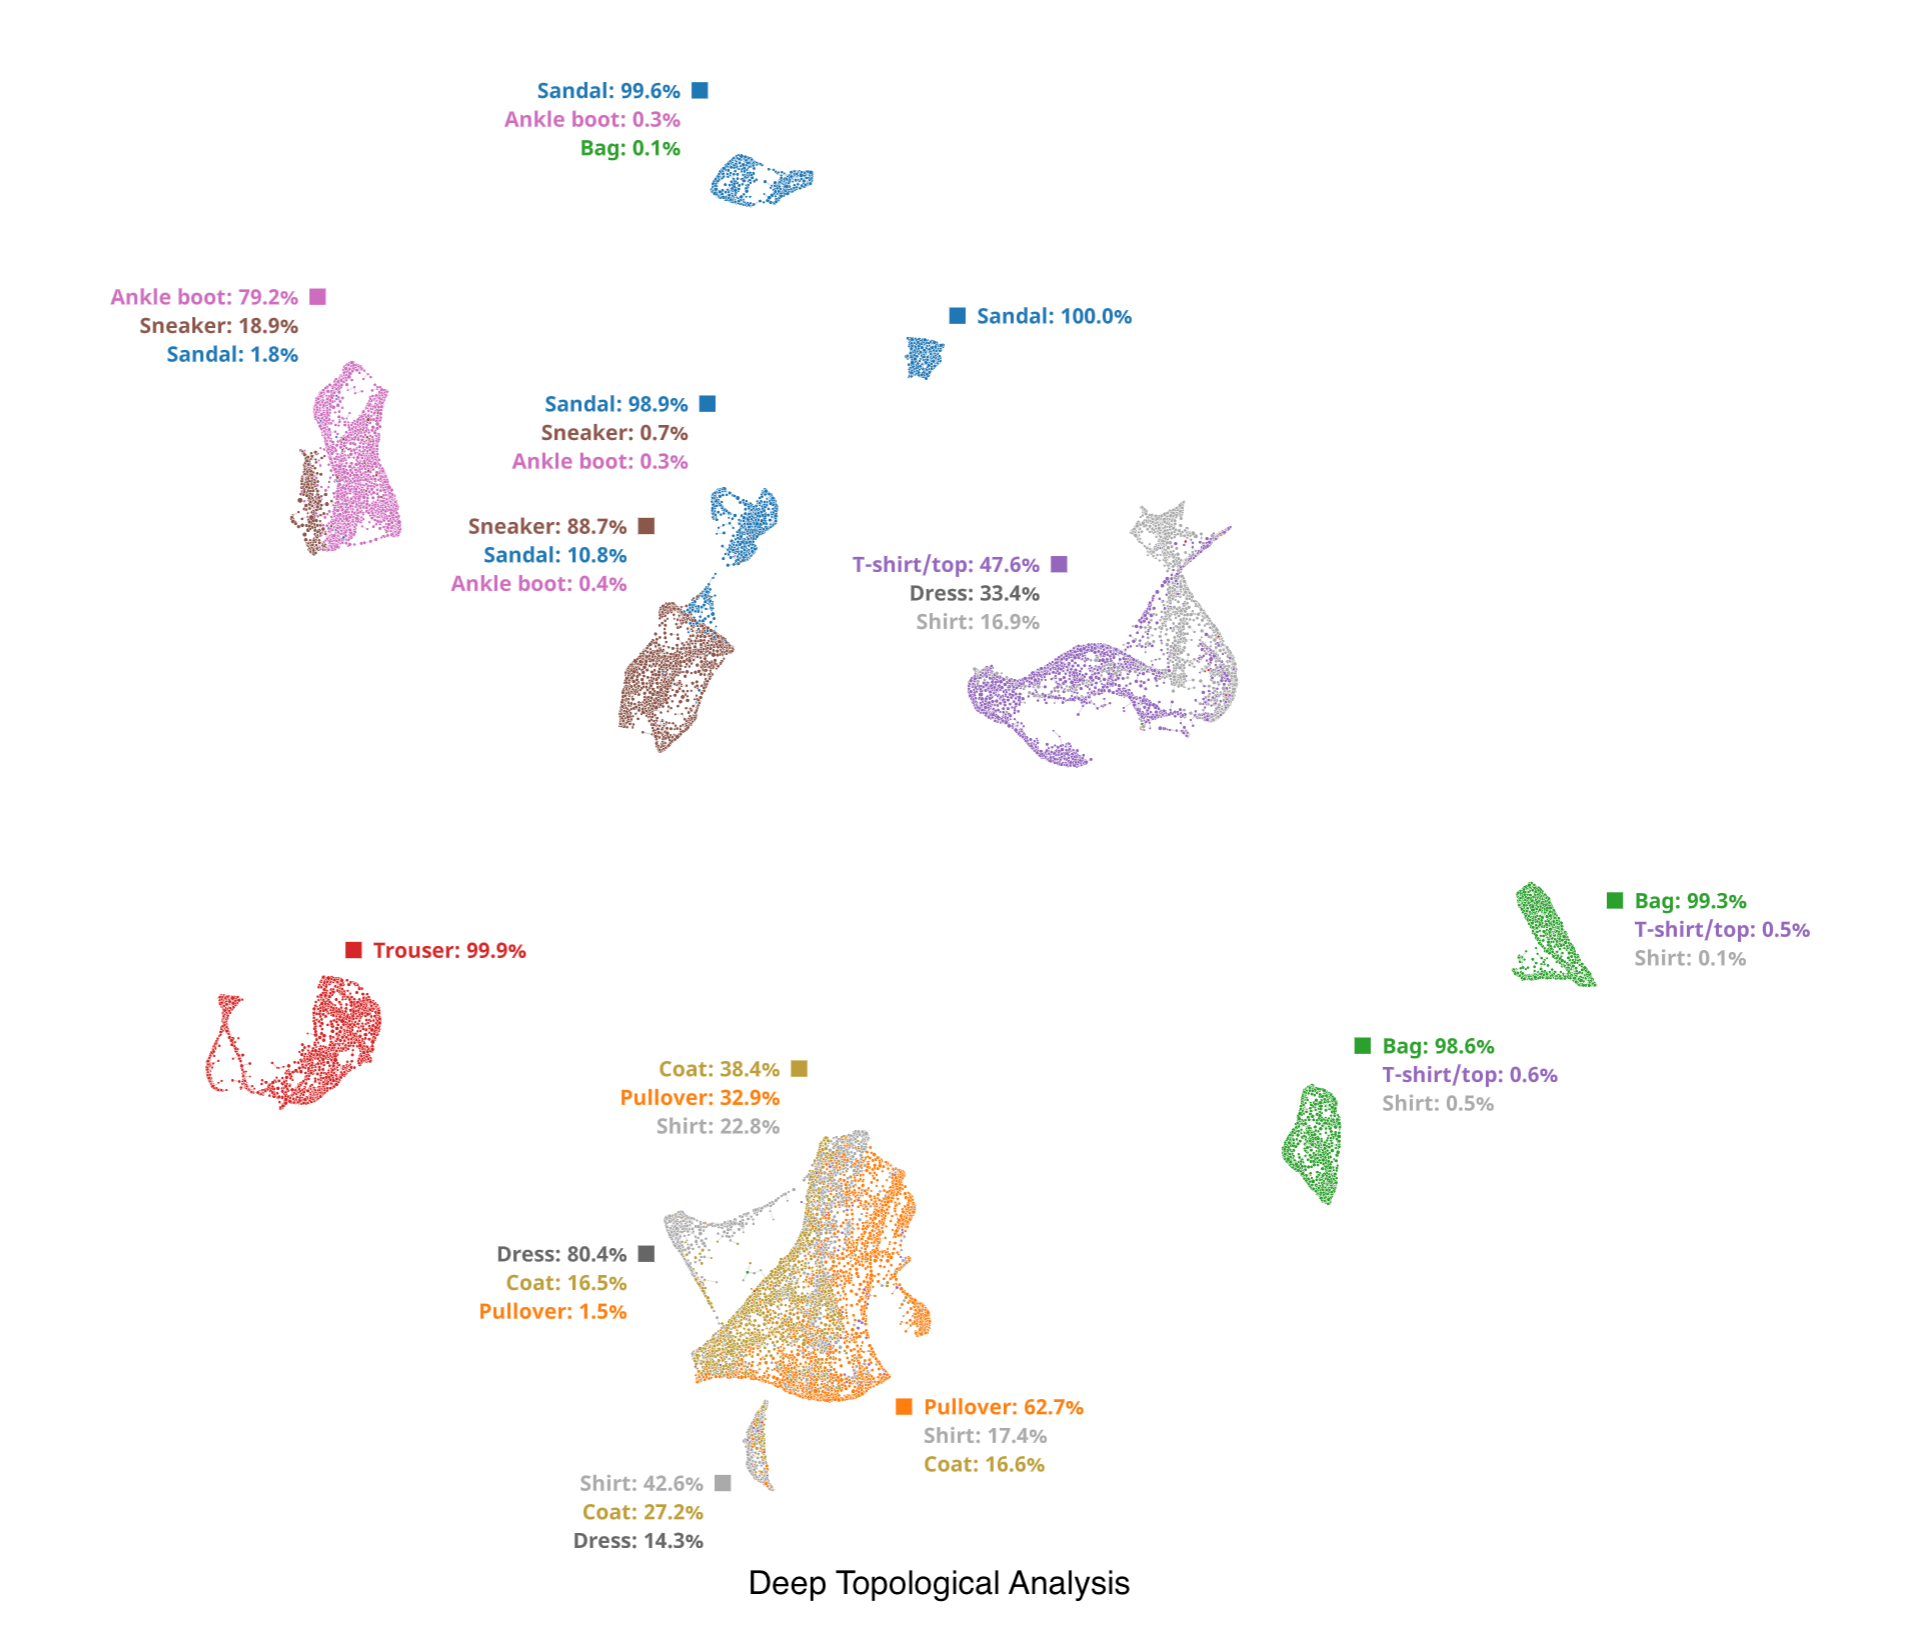
While t-SNE struggles with noise and UMAP delivers mixed results for some classes, TDA excels on this dataset. TDA generates clusters with near-perfect purity, meaning most images within a cluster belong to the same class. Even in cases where some mixing occurs, TDA effectively separates the interloping classes within the cluster.
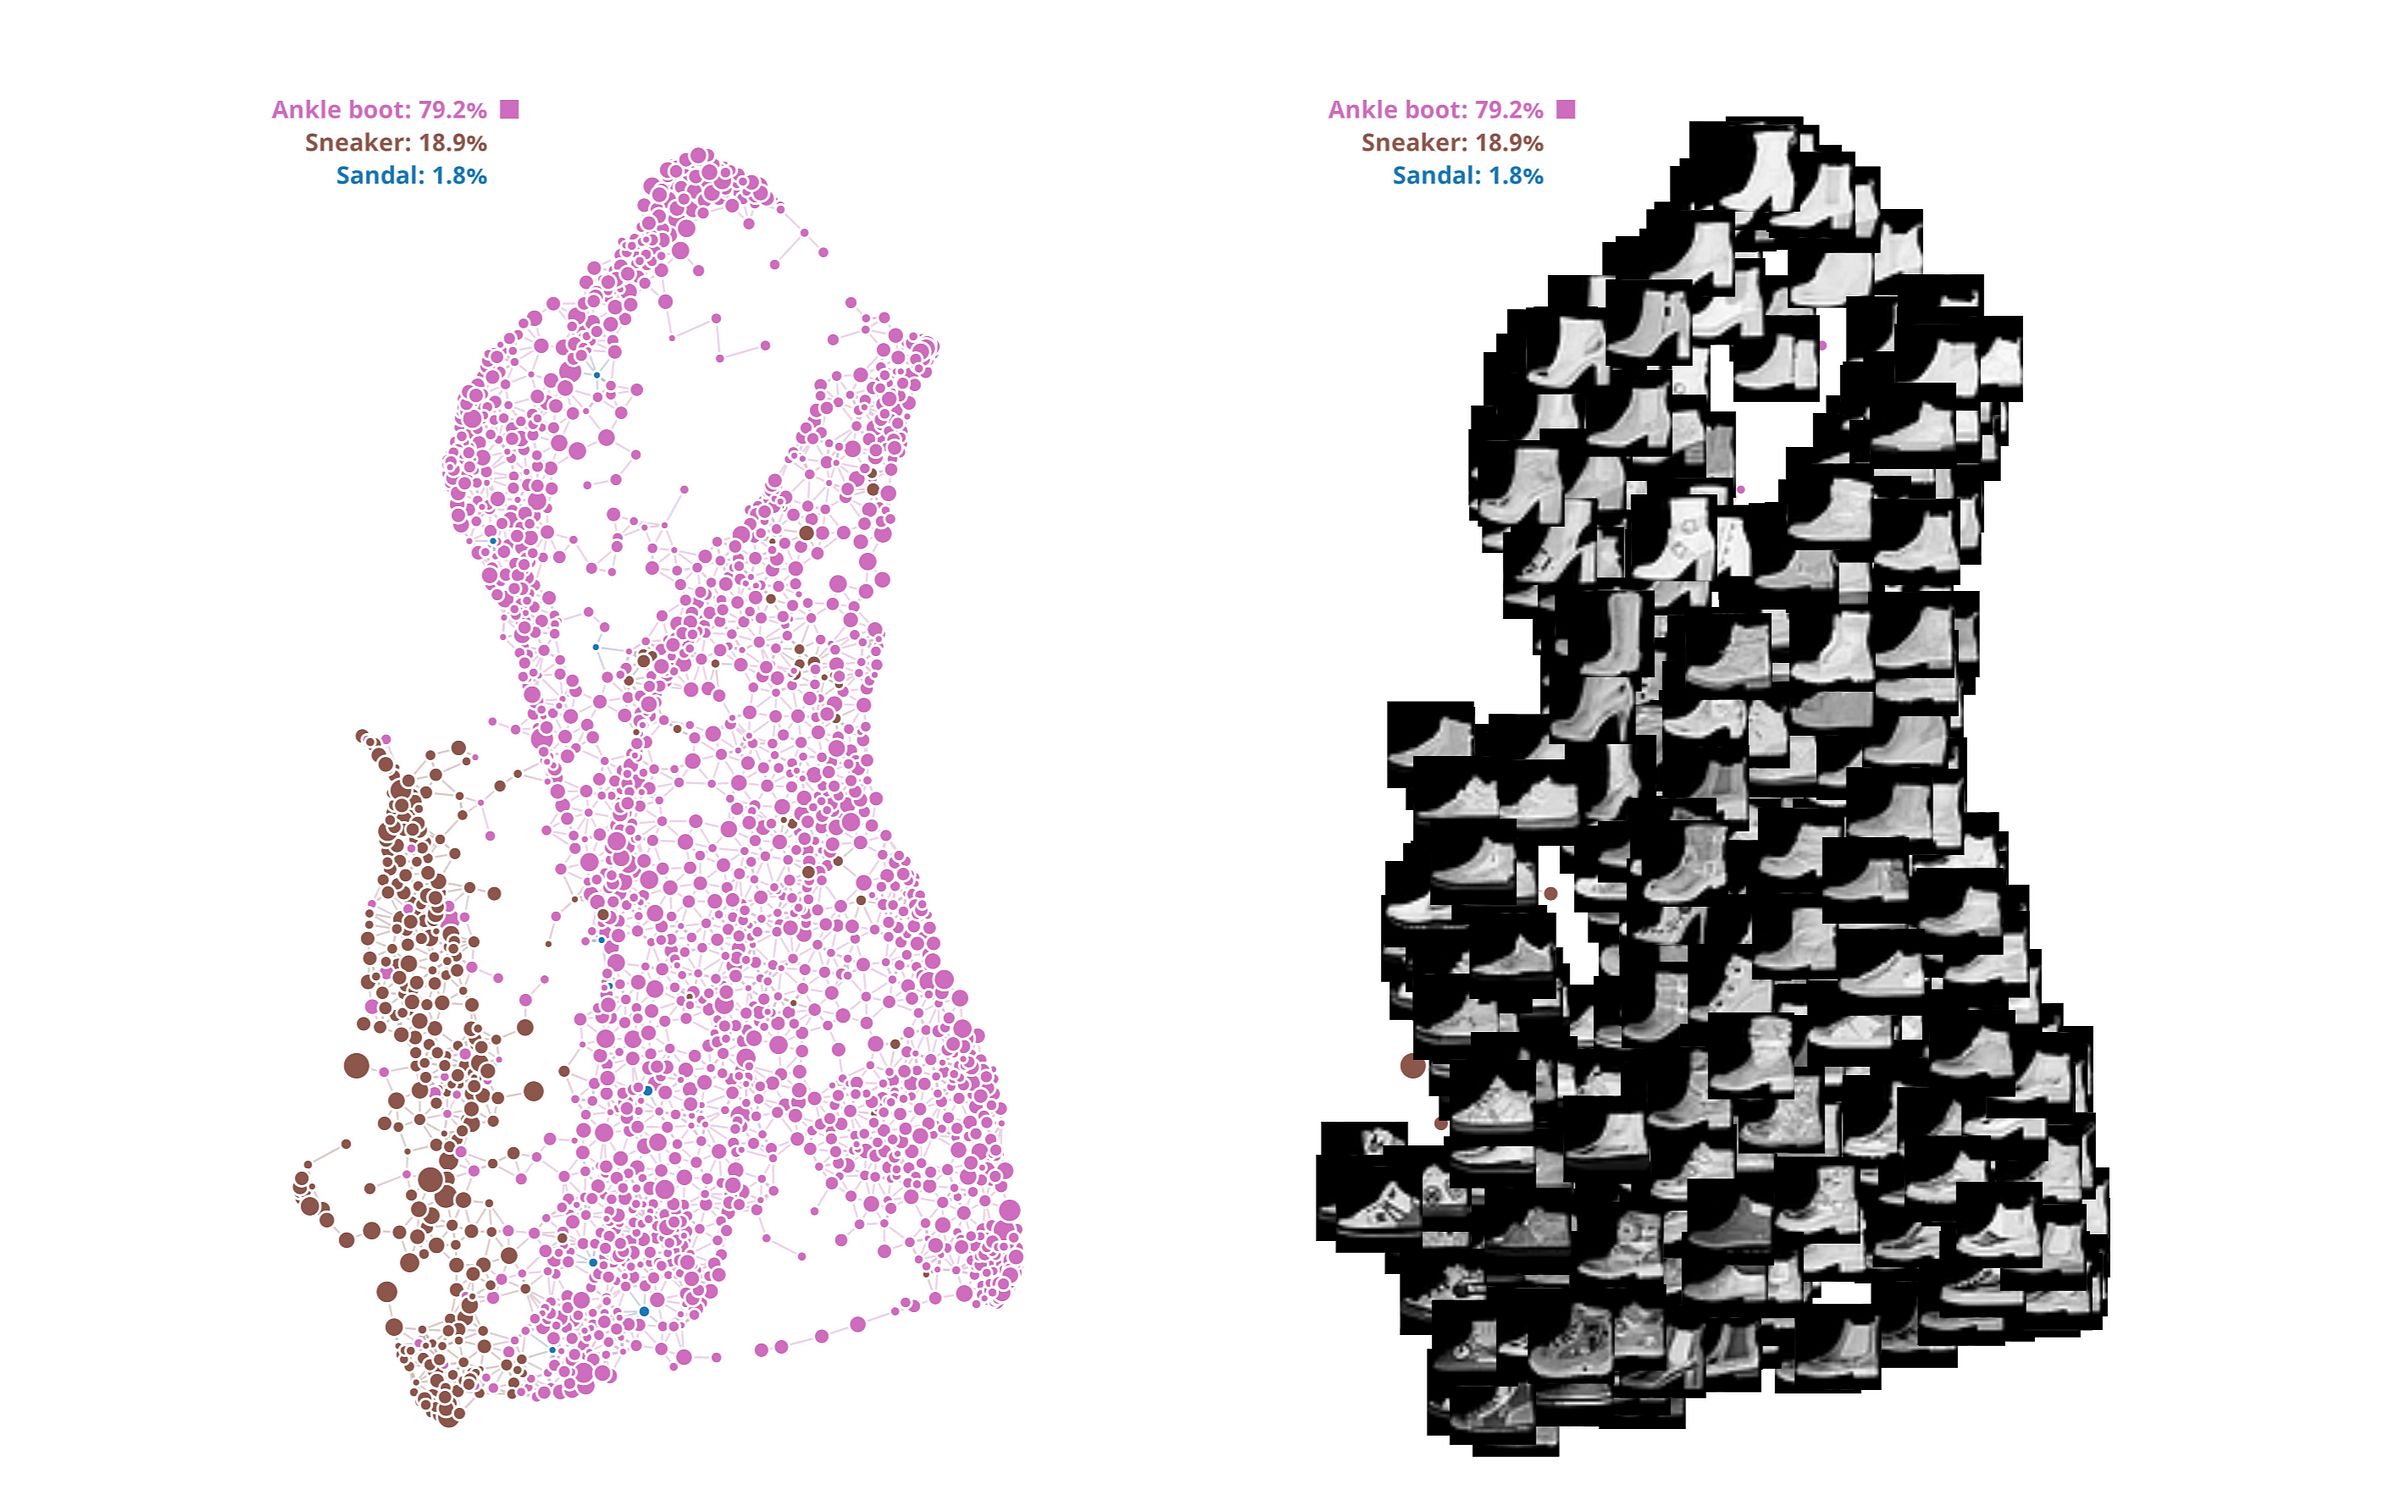
This strength is evident in the transition observed between "sneakers" and "ankle boots." TDA seamlessly groups high-ankle sneakers together, showcasing their gradual transformation into ankle boots within the embedding. This example highlights TDA's ability to capture subtle variations and relationships between visually similar classes, a key advantage for image organization and retrieval tasks.
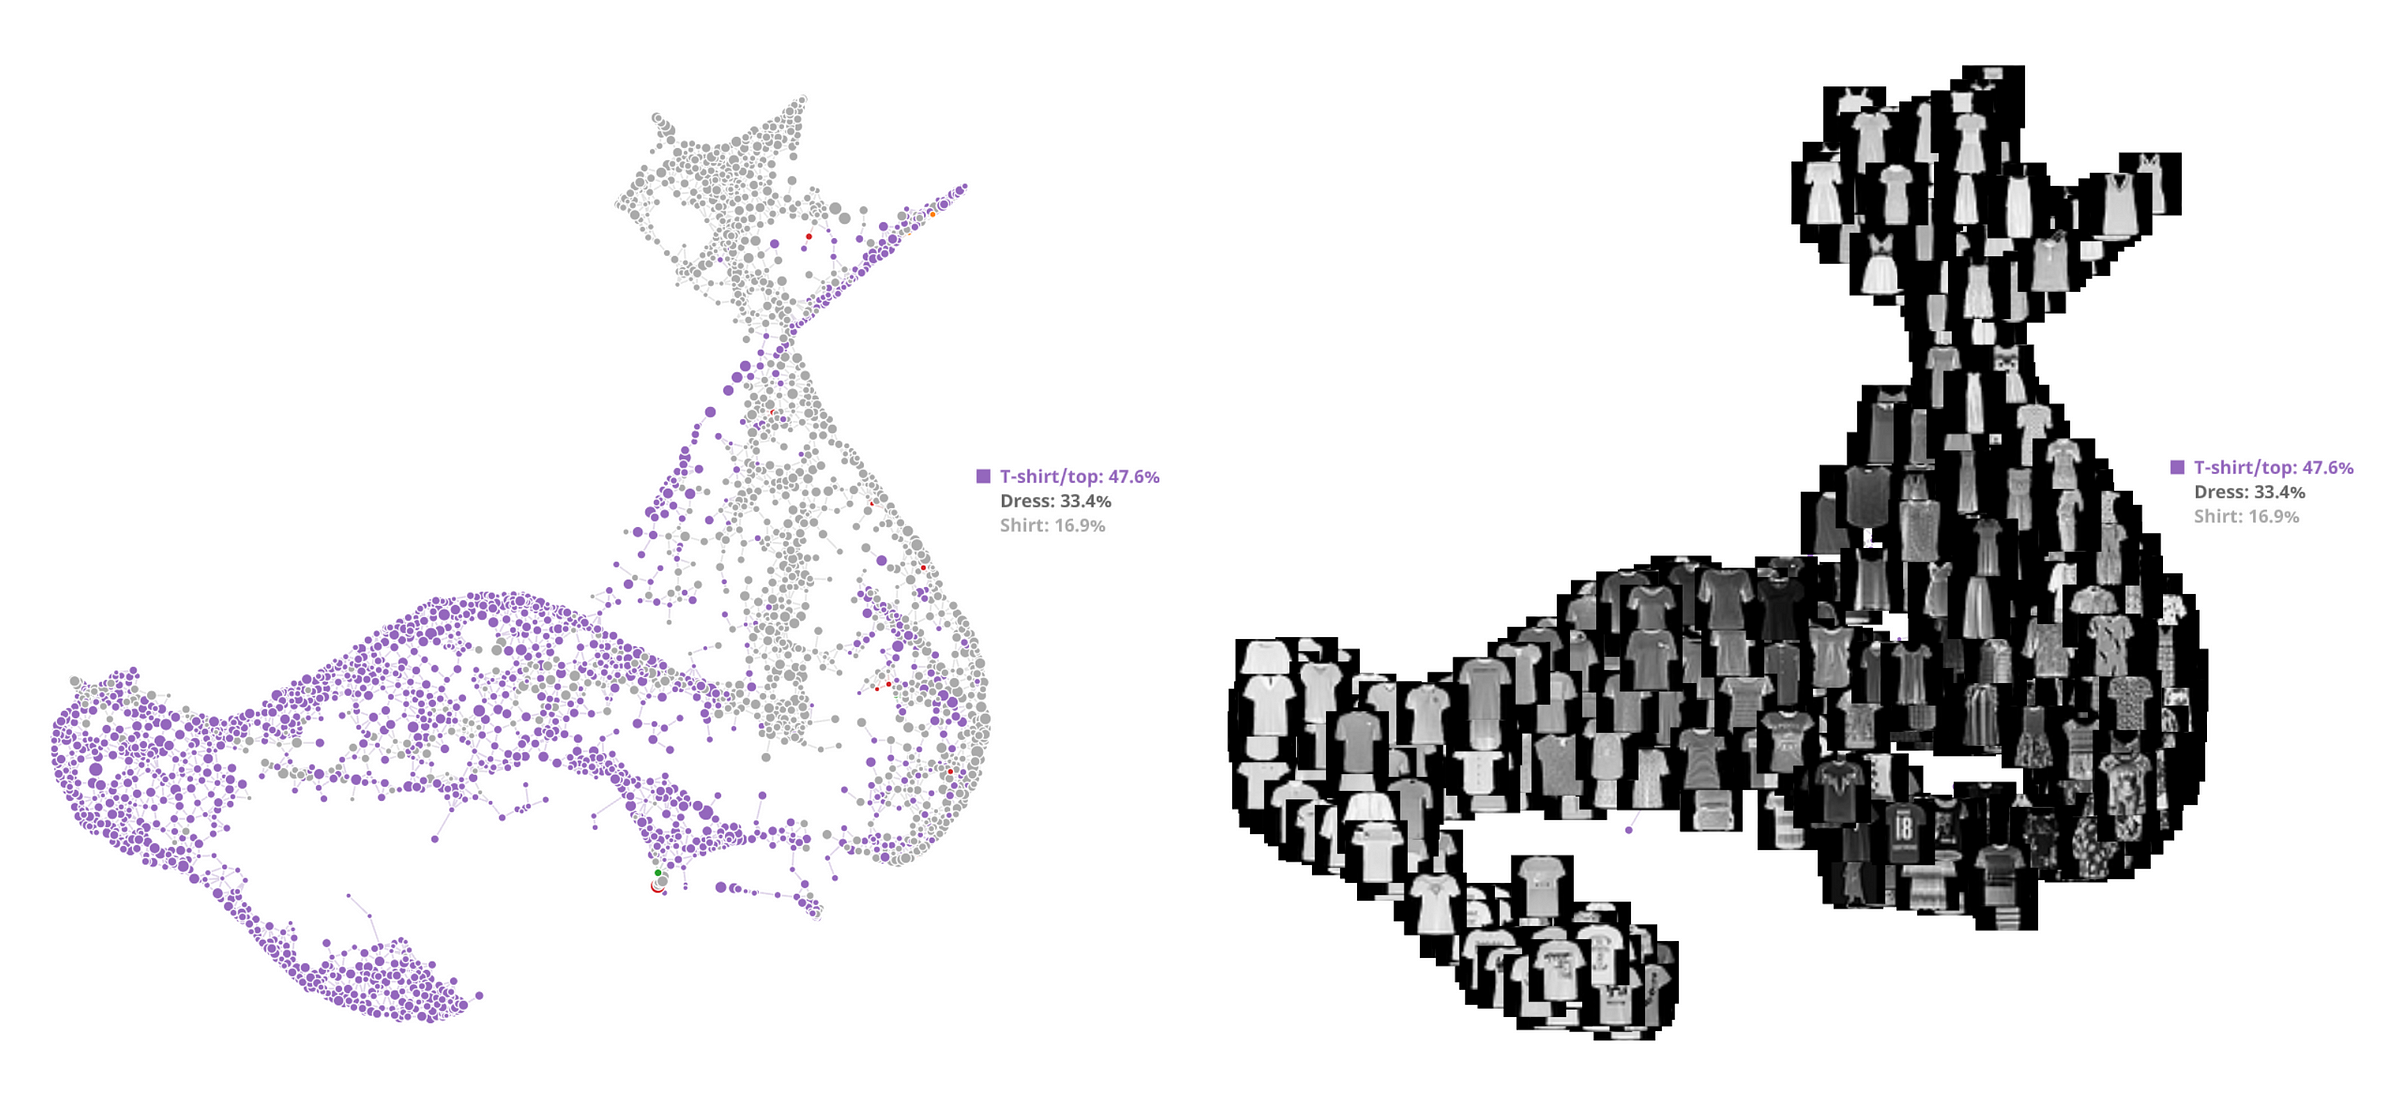
The model depicts a smooth transition between "dress" and "t-shirt" within the embedding space. This visualizes the inherent difficulty in distinguishing certain dress and t-shirt images due to their potentially similar appearances, particularly for items like tunic dresses or long t-shirts.
TDA's performance on the Fashion MNIST dataset mirrors its success on MNIST, despite the latter's relative simplicity. This consistency in kNN accuracy and Adjusted Rand Index (ARI) suggests that TDA effectively generalizes to handle more intricate image classification tasks.
CIFAR-10
CIFAR-10 is a widely used image dataset containing 60,000 labeled images across 10 classes, each with 6,000 images. The dataset encompasses various everyday objects like cars, birds, cats, and more, with each image sized at 32x32 pixels in RGB format. CIFAR-10 serves as a benchmark for testing machine learning algorithms in image recognition tasks, facilitating research and development in computer vision.
Our prior experiments revealed that applying t-SNE and UMAP directly to CIFAR-10 images yields unsatisfactory results. These complex, colorful images tend to cluster together as a single mass, hindering effective dimensionality reduction and visualization. Read more:
Instead, we utilize tranfer learning: a pre-trained ResNet model, originally trained on the massive ImageNet dataset, to generate informative embeddings for the CIFAR-10 images. Subsequently, t-SNE or UMAP can be effectively applied to these embeddings, enabling meaningful exploration of the data's underlying structure.
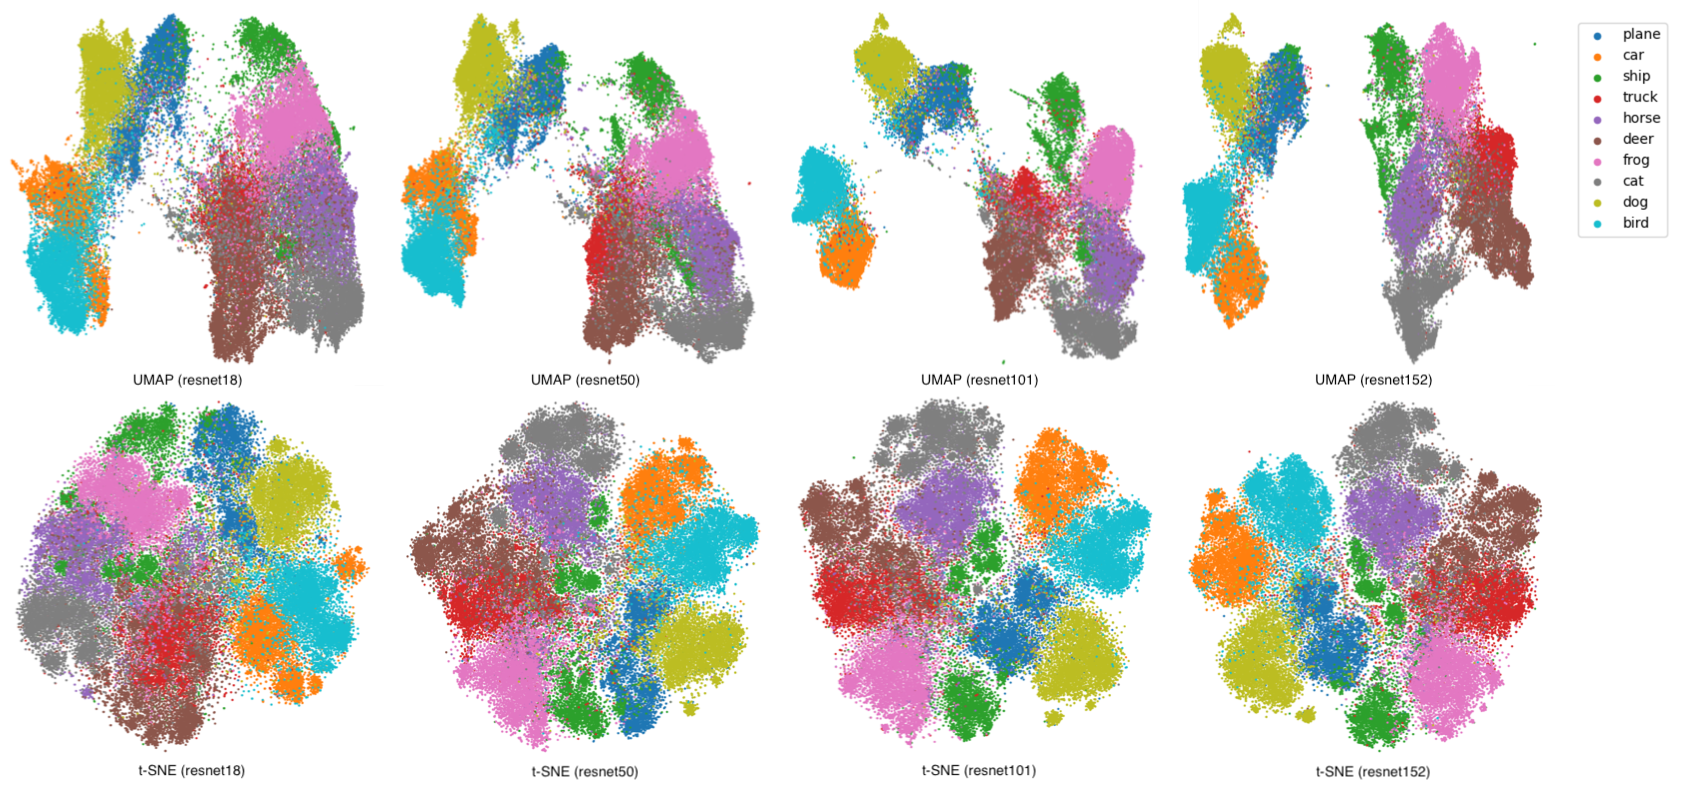
Even leveraging a powerful pre-trained ResNet152 model followed by t-SNE or UMAP fails to deliver a well-separated 2D representation for the CIFAR-10 dataset. This highlights the limitations of dimensionality reduction techniques for inherently complex, high-dimensional data like CIFAR-10.
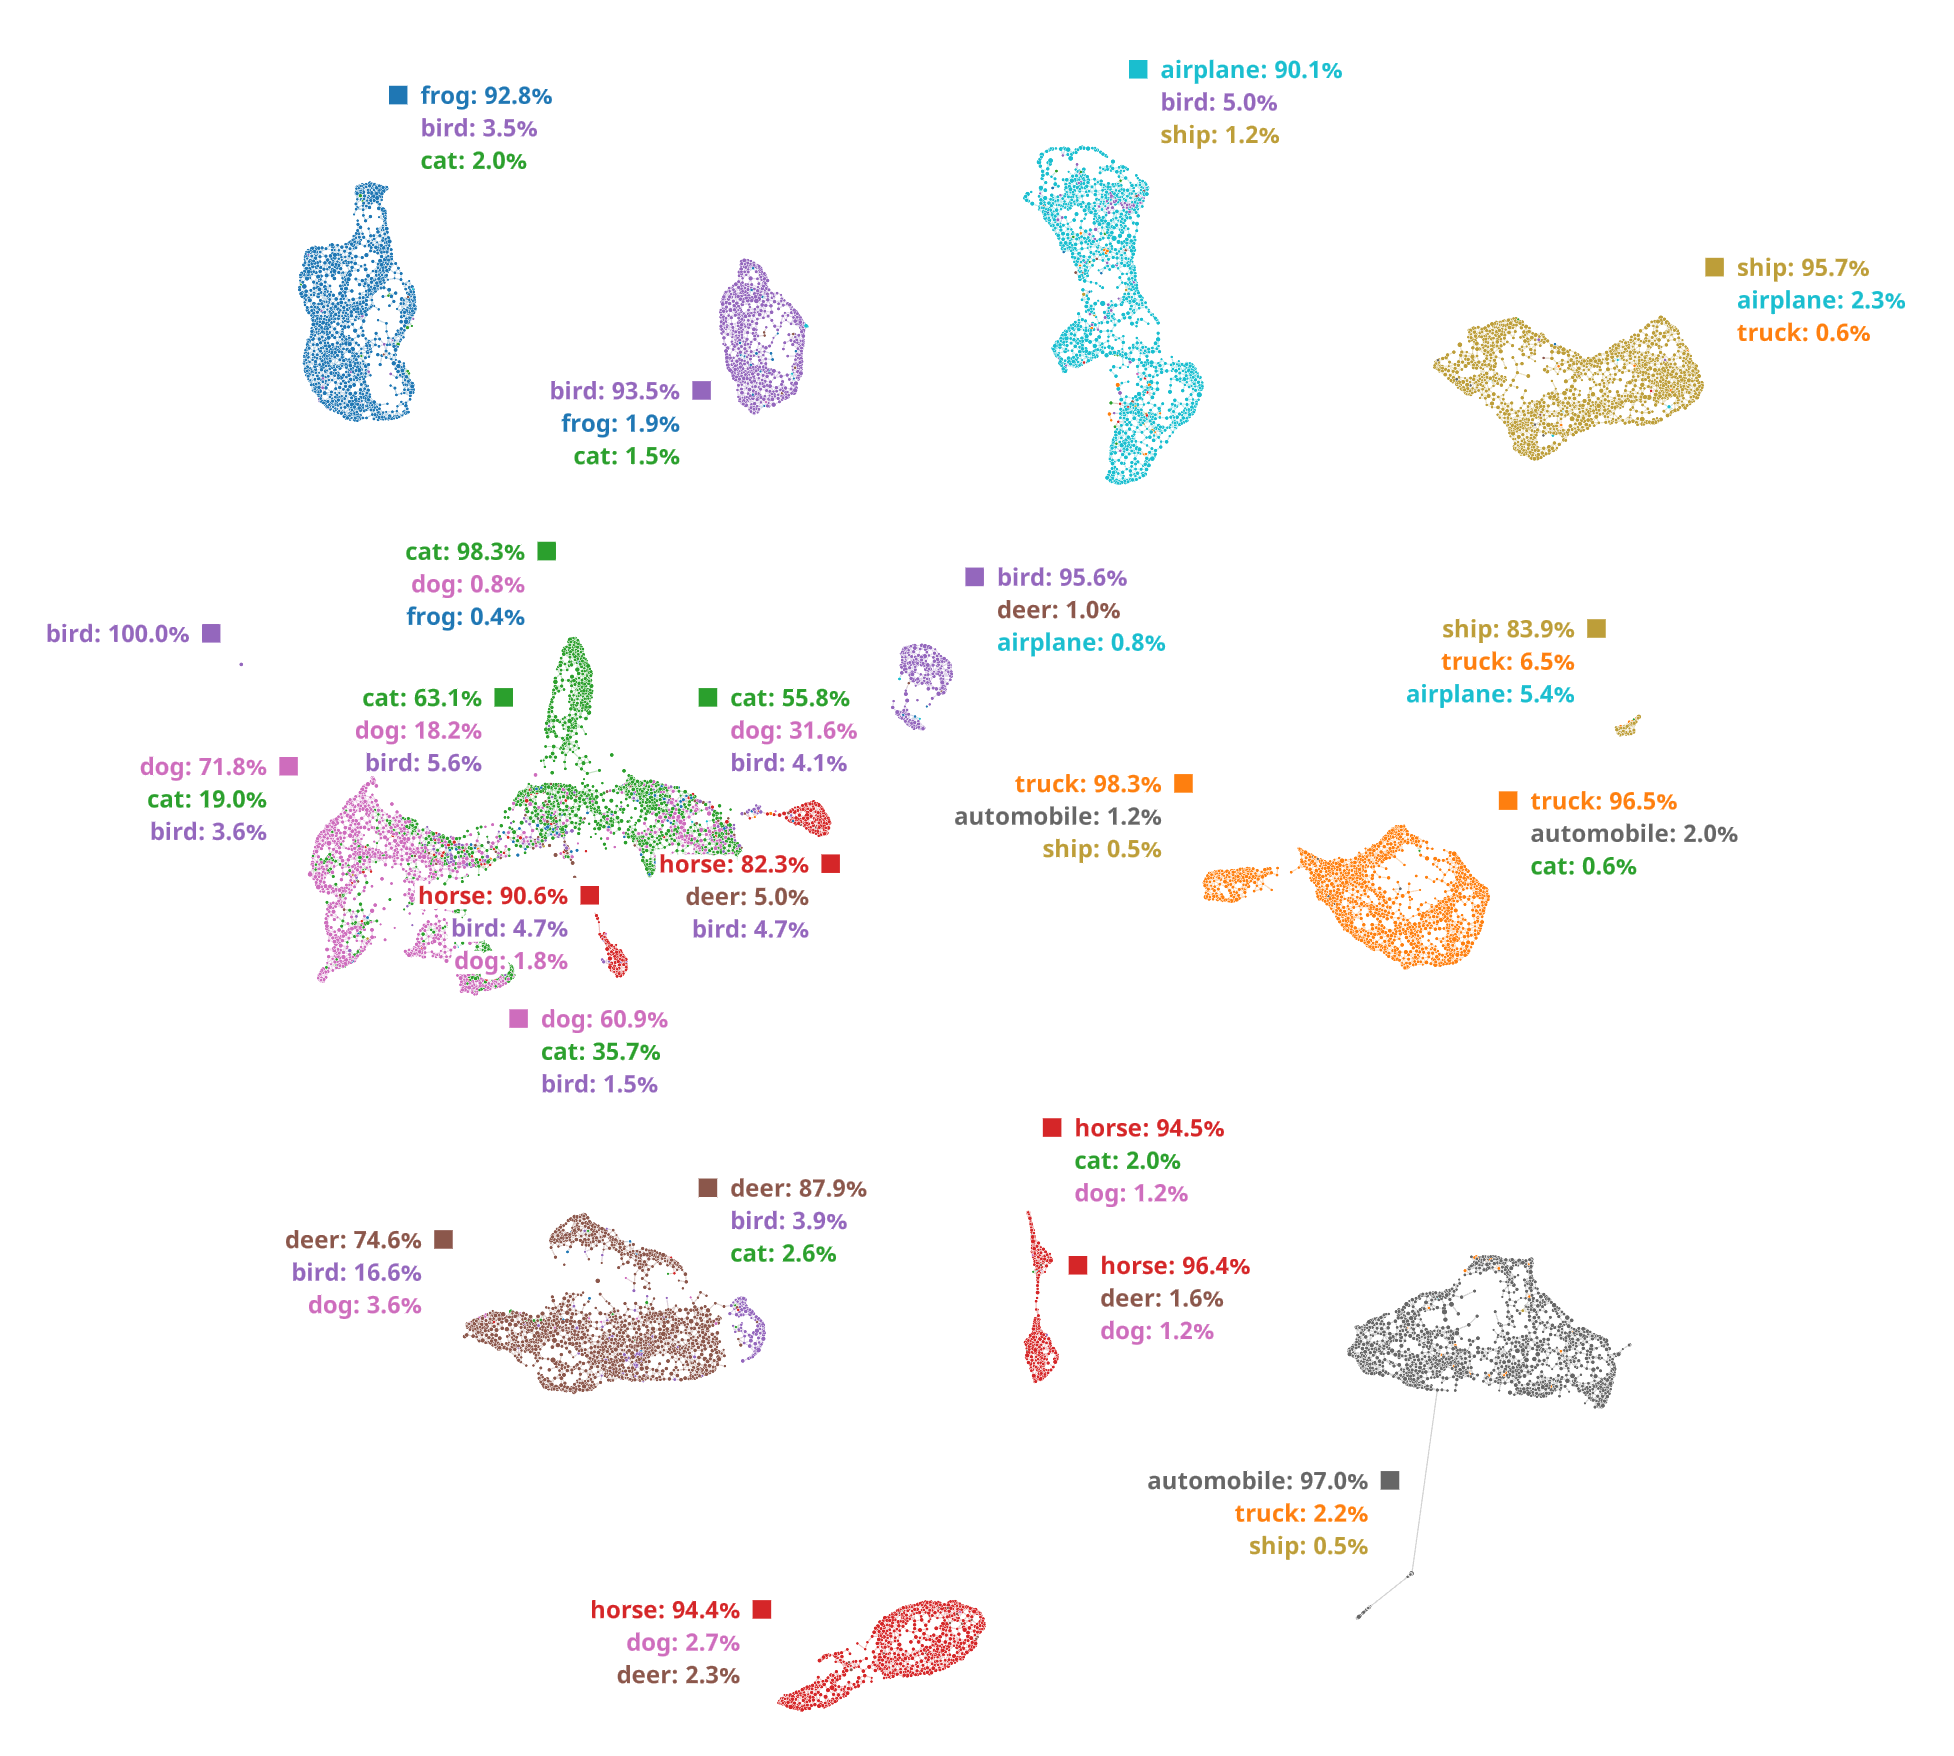
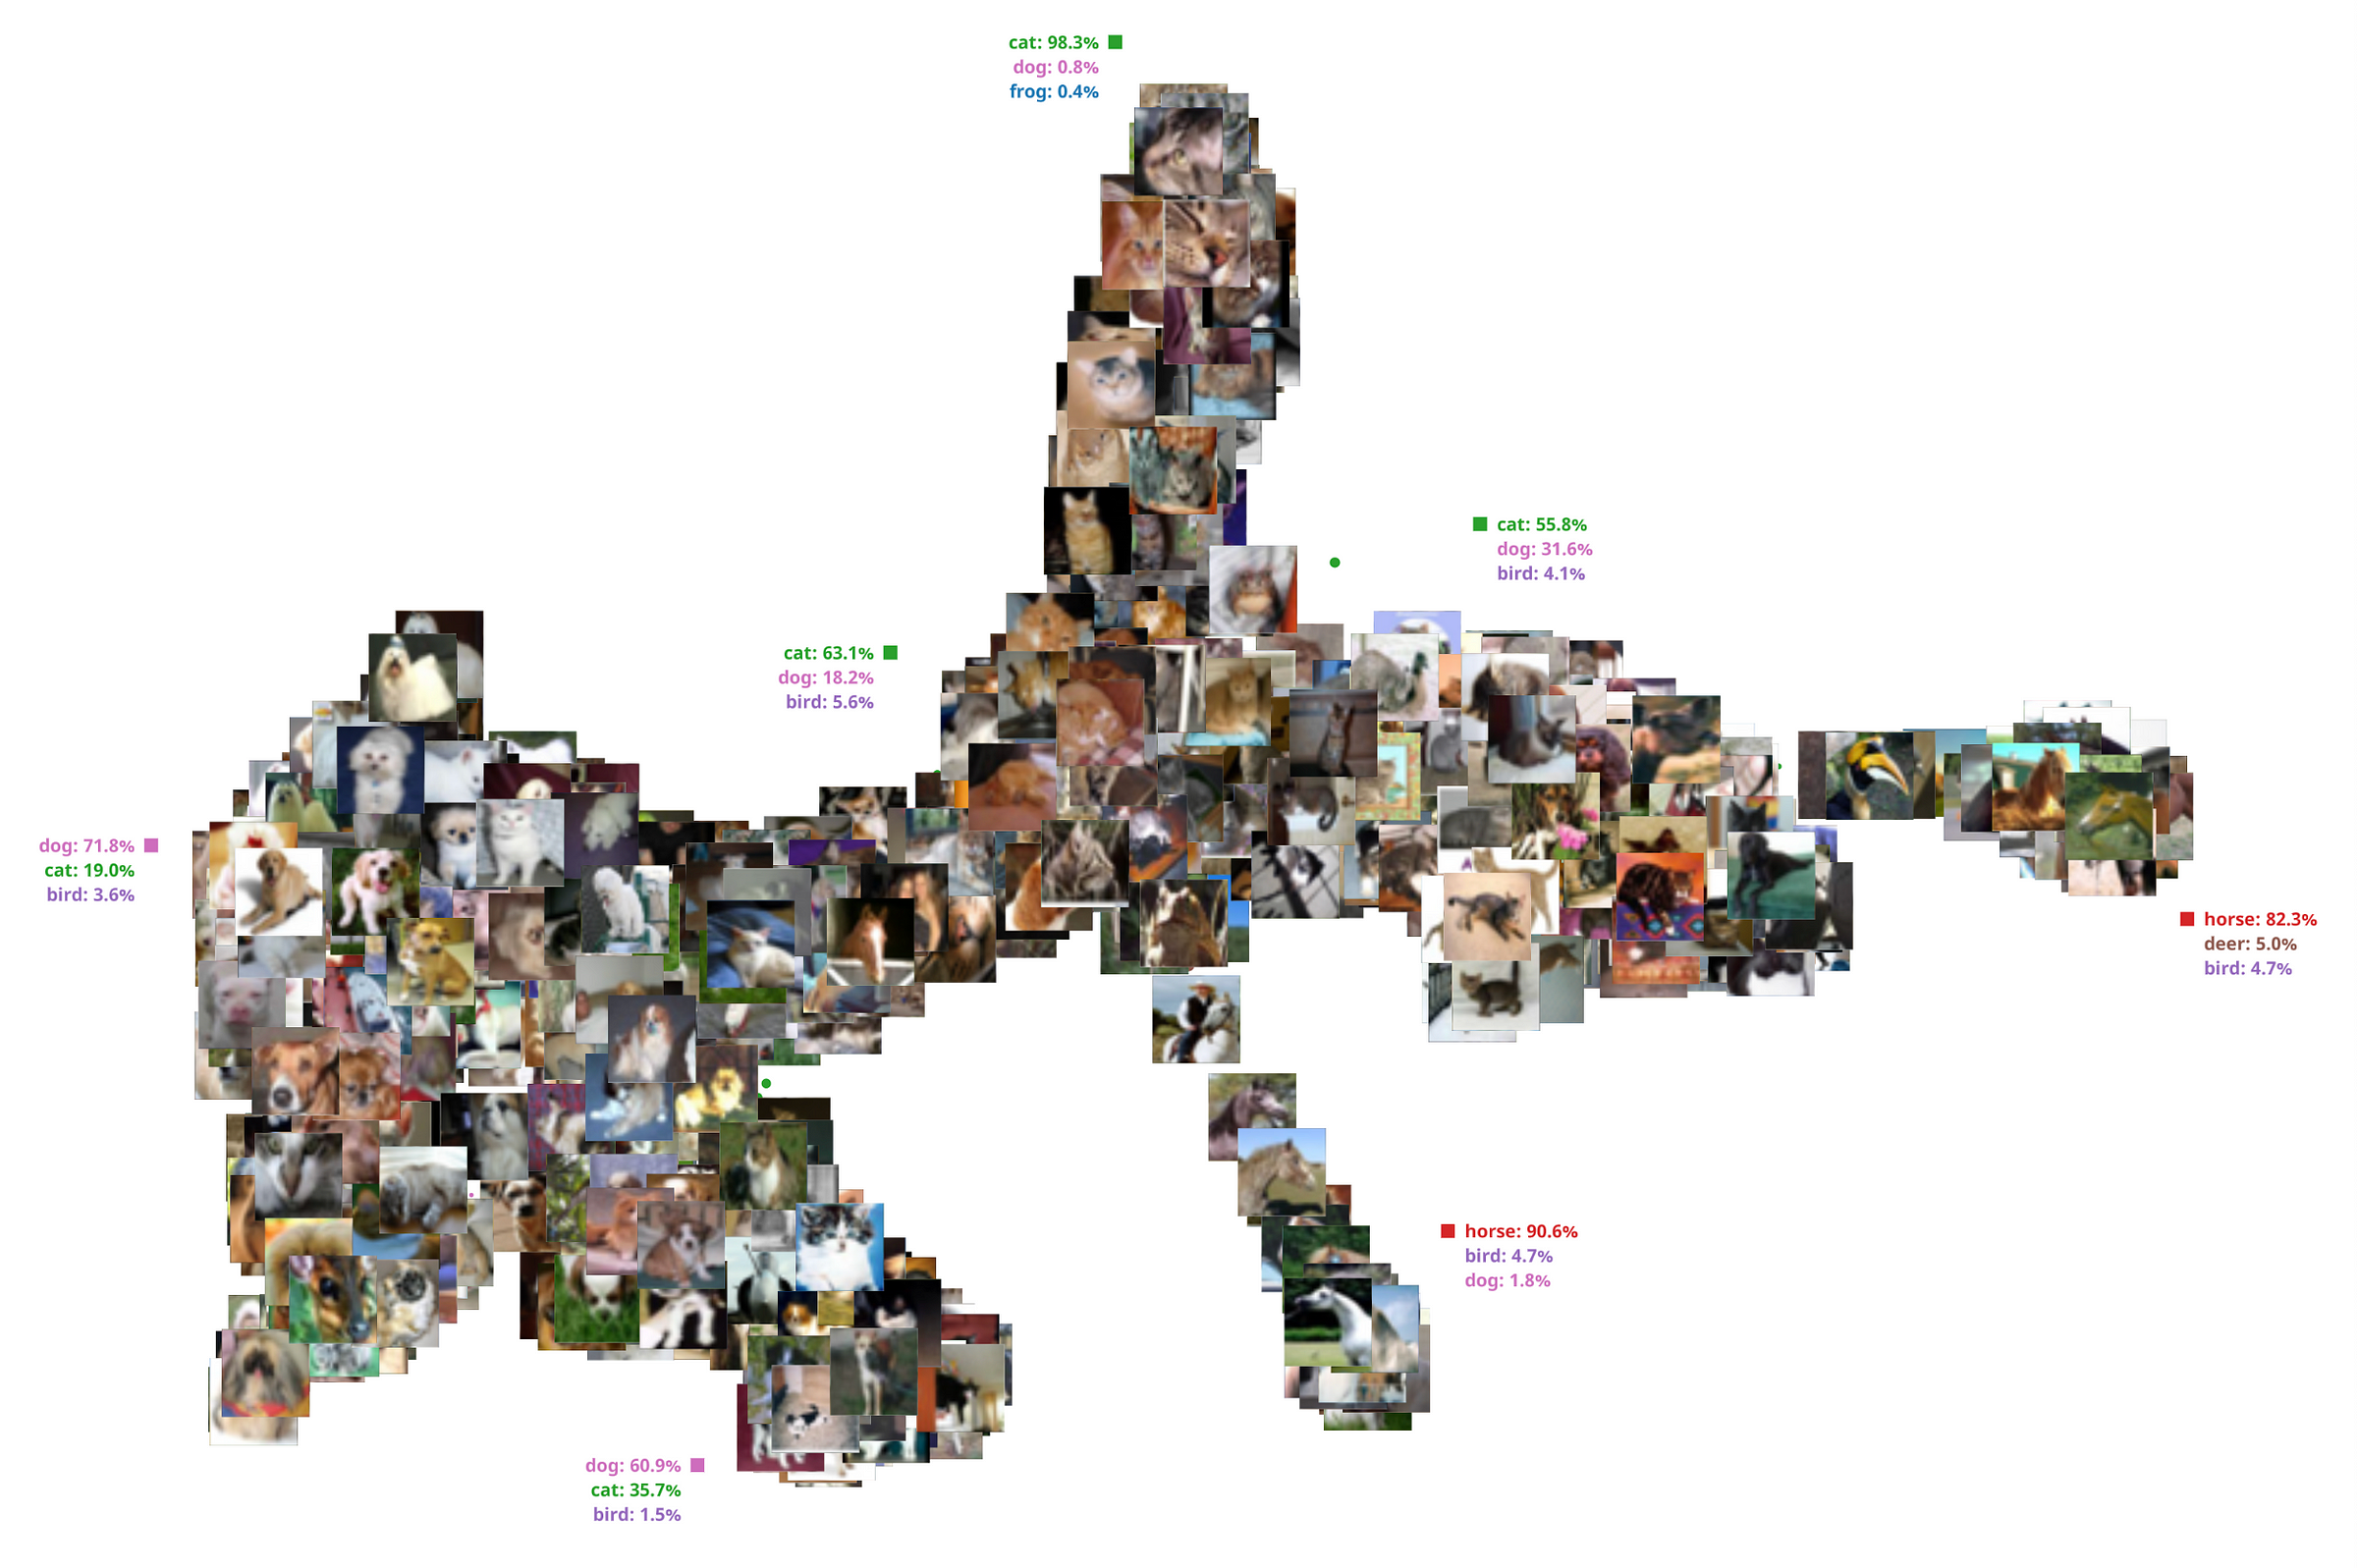
In contrast, Topological Data Analysis (TDA) shines on this dataset. It produces exceptional segmentation quality, with only a single major mixed cluster observed between dogs and cats. This compelling result underscores TDA's superiority in handling intricate image datasets where traditional dimensionality reduction methods struggle.
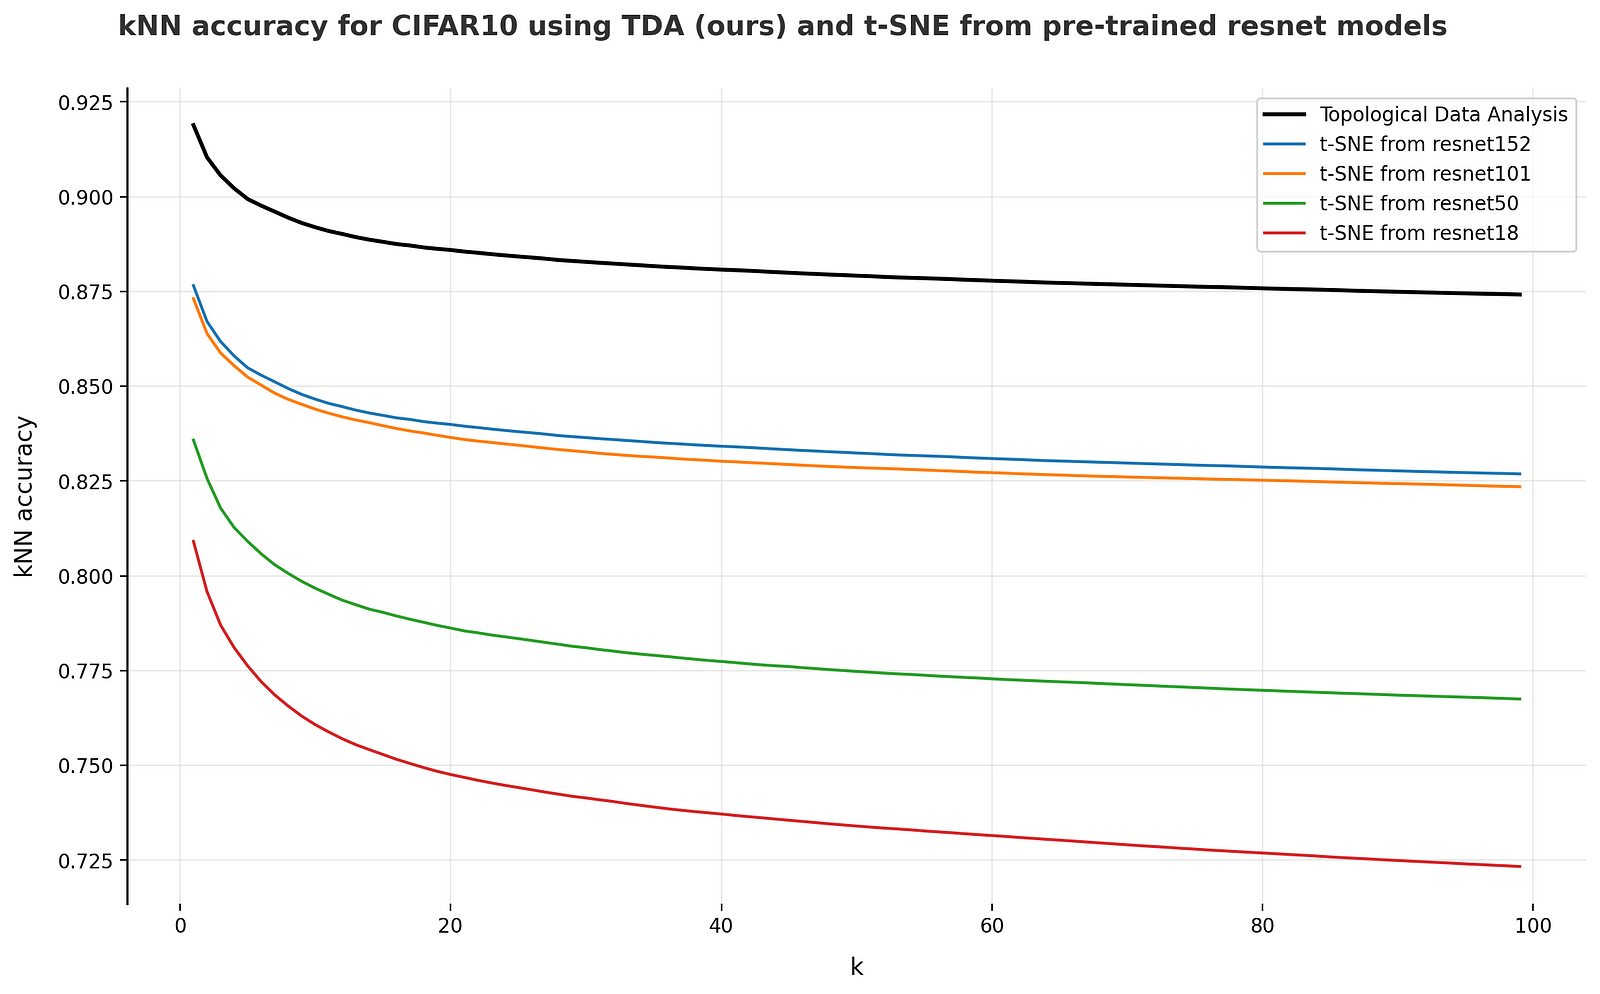
From quantative perspective, TDA has a much higher kNN accuracy:
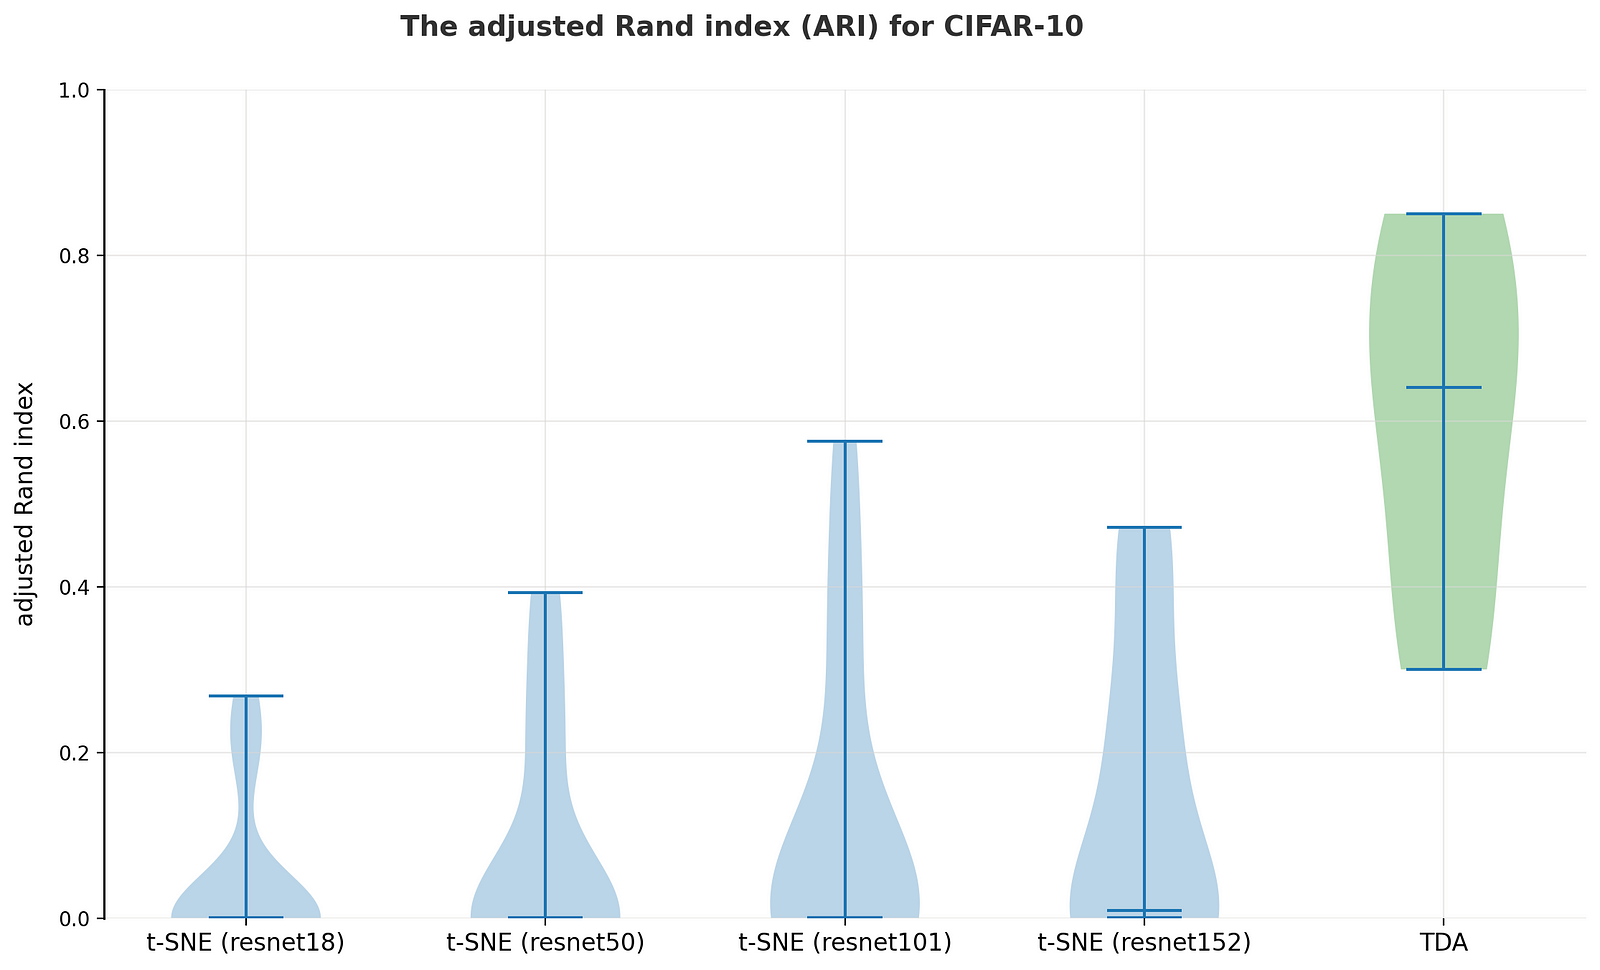
The adjusted Rand index is showing a significant improvement of TDA clusterization over pre-trained ResNets:
Integration into your business pipeline
TDA's image segmentation capabilities unlock significant value when embedded within your company's existing pipeline. This integration empowers you to automate tasks, streamline workflows, and gain deeper insights from your image data.
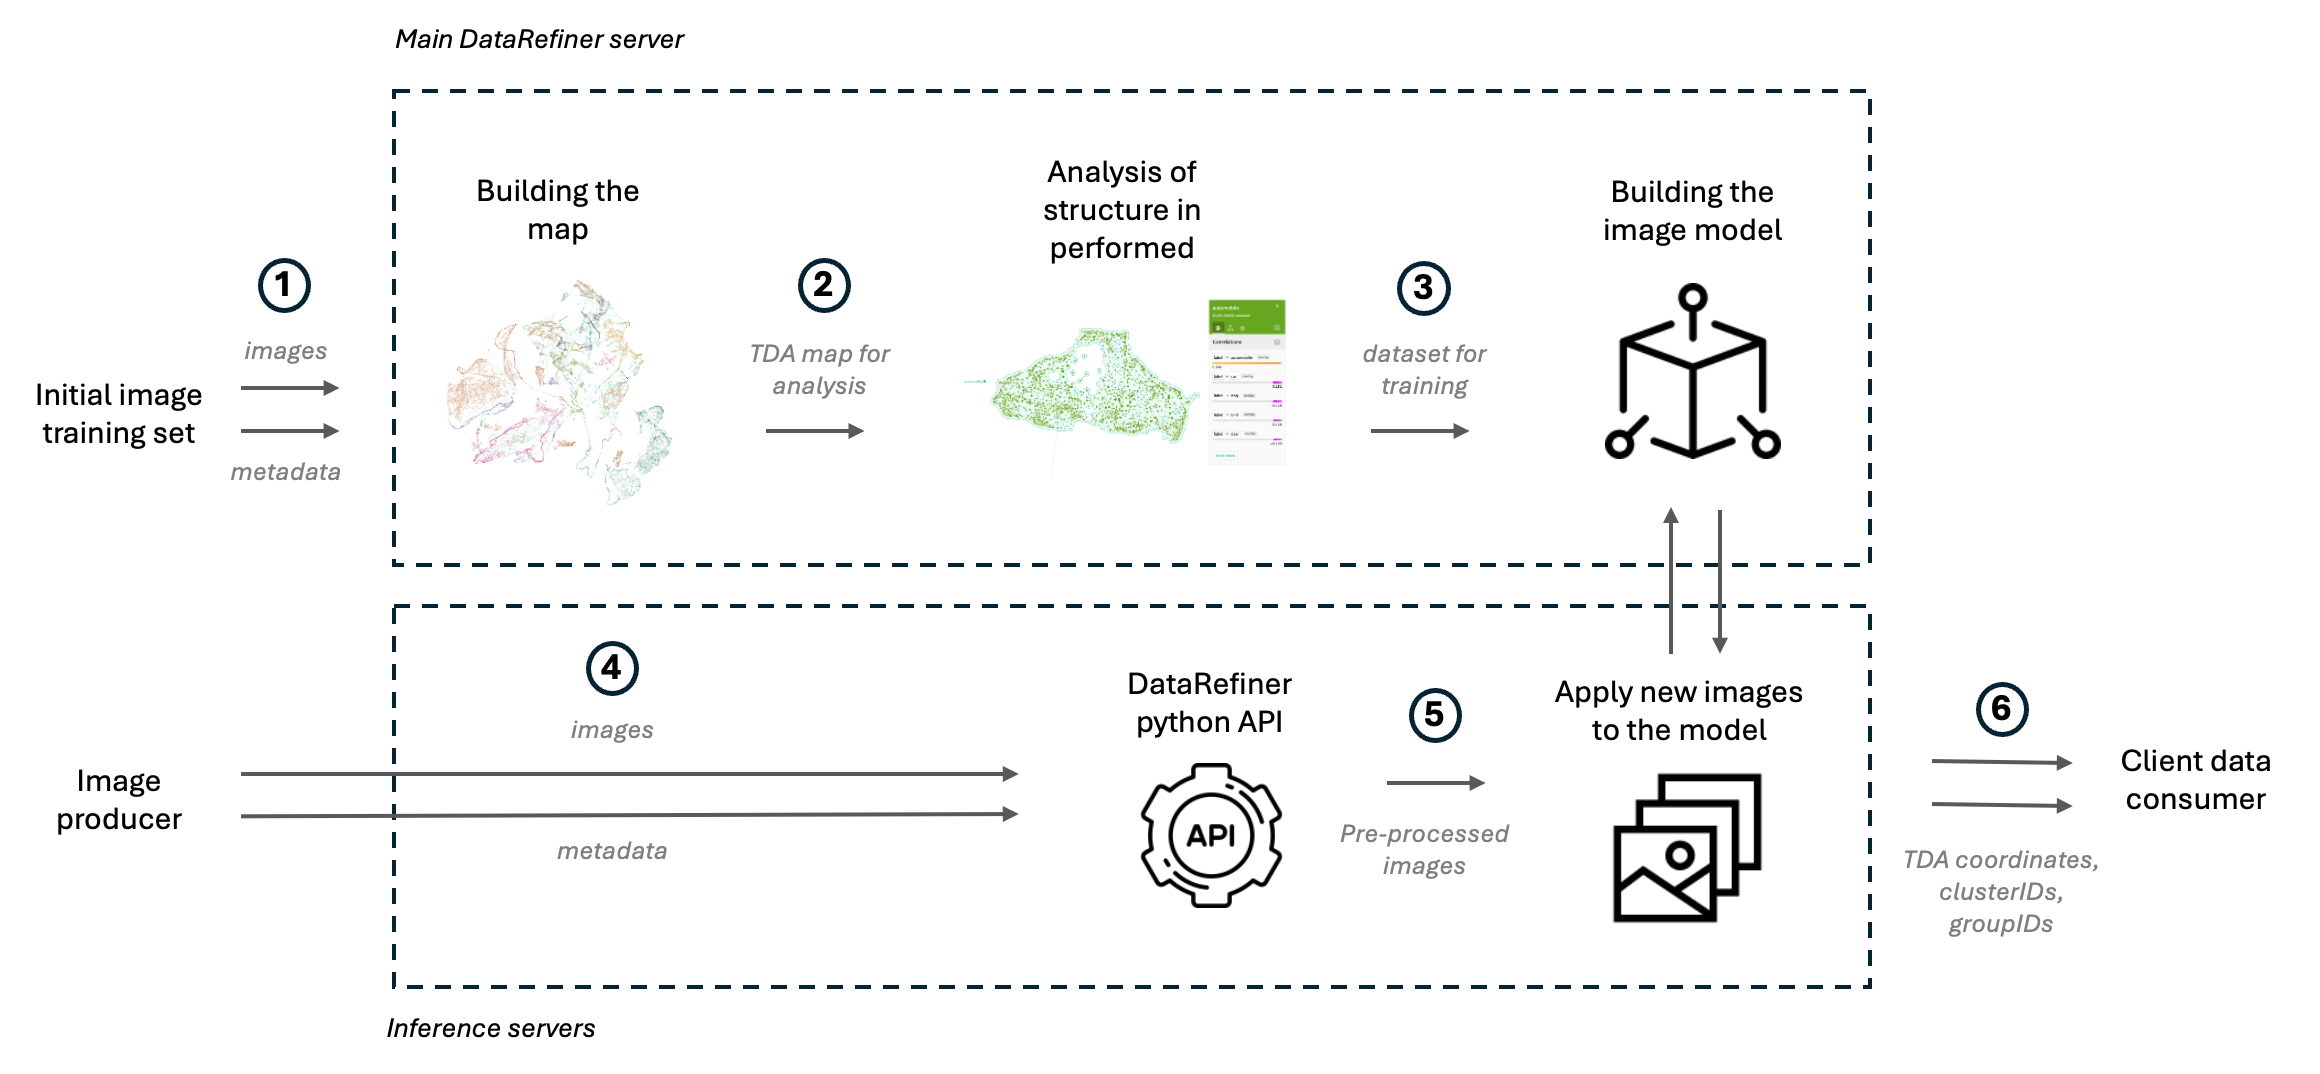
Integrating TDA's powerful image segmentation into your company pipeline is a straightforward process. Here's a step-by-step guide:
- Data Preparation: Begin by preparing your image dataset. You can include additional information relevant to your images in a separate CSV file. This data will be used later during the analysis of TDA map.
- Expert Analysis and Refinement: Once the initial clustering is complete, a subject matter expert can review the results. This expert can analyze the structure of the clusters, assign meaningful names and groups to them, and even edit the clusters if necessary to ensure optimal accuracy.
- Lightweight Deployment: The resulting TDA model is compact and can be saved as a Docker container. This lightweight format allows for easy deployment anywhere, including edge devices, for real-time image processing.
- New Image Processing: As new images arrive from your image source, they'll be fed into the TDA model for clustering.
- Data Refiner Python API: Leveraging the DataRefiner Python API, users can interact with the deployed TDA model. The API retrieves predicted data for new images, including the assigned cluster ID, cluster name, and even the internal 128-dimensional embedding representation used by TDA.
- Enriched Data for Next Steps: The retrieved information, including cluster details and potentially the embedding, can be seamlessly integrated with subsequent processing steps in your pipeline. This enriched data can be used to train machine learning models or for other downstream tasks.