
Root Cause Analysis enhanced by Causal Discovery and Topological Data Analysis
We present a novel approach to causal discovery using boosting trees together with TDA
The Challenge
Causal discovery is the task of obtaining causal relationships between variables from observational data. This is in contrast to correlation analysis, which only identifies statistical associations between variables. Root Cause Analysis, based on causal discovery, is essential for many machine learning tasks, such as fraud detection, drug discovery, and climate modeling. Causal discovery, a critical component of Root Cause Analysis, applies across a broad range of problems faced by businesses across a range of industries.
Topological data analysis (TDA) is a field of mathematics that studies the topological properties of data sets. Topological properties are those that are preserved under continuous deformations, such as the number of connected components or the existence of holes. TDA has been used to solve a variety of problems in machine learning, including clustering, classification, and anomaly detection.
The challenges that causal discovery and TDA solve, as part of Root Cause Analysis, include:
- Hidden Causal Structures in High-Dimensional Data: Employing TDA to identify topological features within high-dimensional datasets, which can aid in revealing hidden causal structures that might be challenging to detect using conventional methods.
- Anomaly Detection with Causal TDA: Combining TDA and causal inference to detect anomalies in data by identifying both topological irregularities and their potential causal explanations, improving anomaly detection accuracy.
- Non-linearity: The relationships between variables in many real-world systems are non-linear. This means that they cannot be modeled by simple linear relationships.
- Feature Selection for Causal Models: Using TDA to guide feature selection in causal models by selecting variables that exhibit significant topological importance, improving the accuracy of causal discovery.
DataRefiner is commonly employed in the analysis of complex issues such as "semiconductor manufacturing processes" or the analysis of "aircraft engine performance." These particular applications involve an extensive array of parameters, sometimes reaching up to 100,000 dimensions, making them exceedingly challenging for human analysis.
Enhanced understanding of the relationships between features and processes is advantageous for addressing each of these challenges, a feat that causal discovery, a key aspect of Root Cause Analysis, can help effectively.
The Idea
The concept underlying the inclusion of causal discovery is to uncover causal relationships and the capability to illustrate these relationships for the entire dataset or separately for each cluster within the data.
Here, we provide an illustration of a clustered analysis that examines the causal links between the socioeconomic indicators considered in our study and the rates of confirmed COVID-19 cases in different regions of the USA spanning from February 2020 to July 2020 [1].
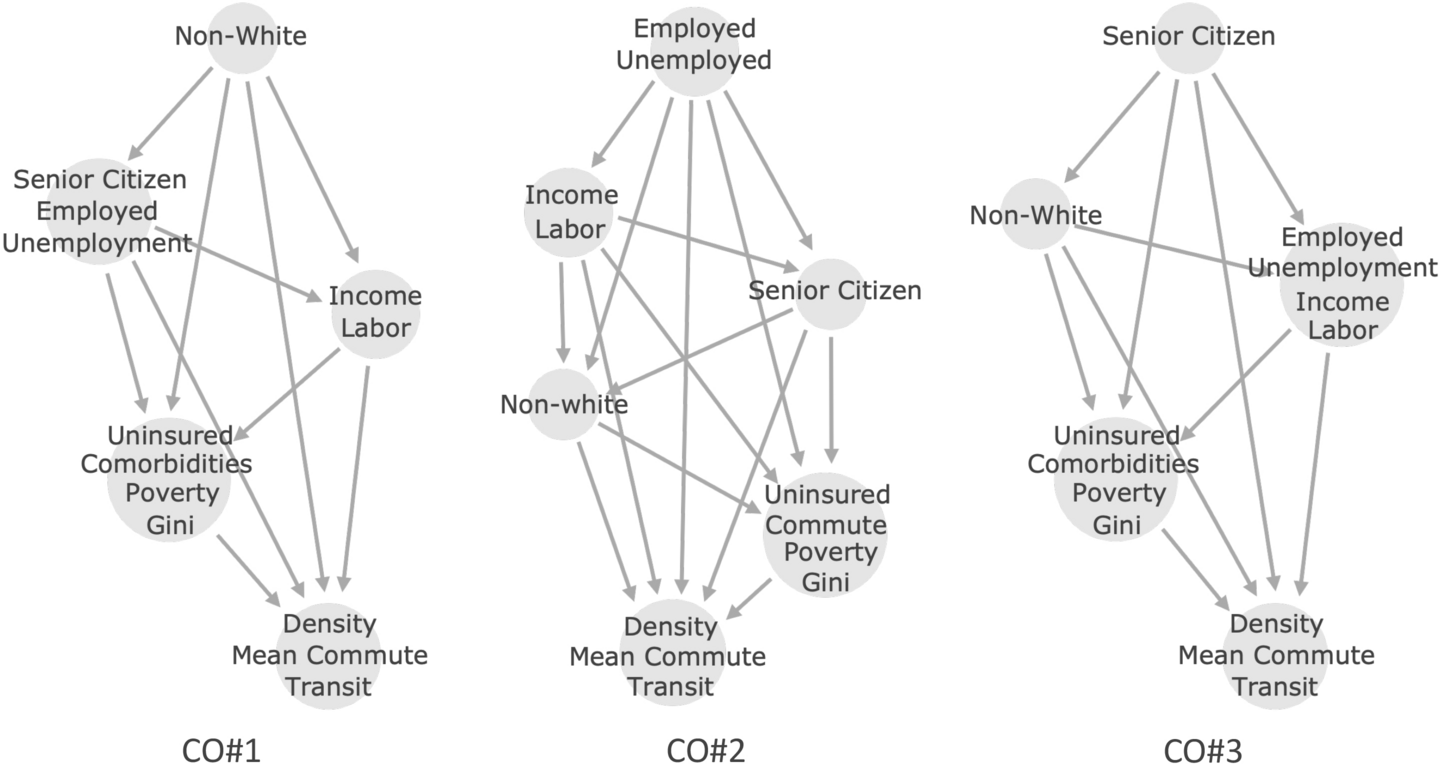
Causal connections between socioeconomic disparities and COVID-19 in the USA.
The three primary segments of causal ordering that we consider in the white paper [1]
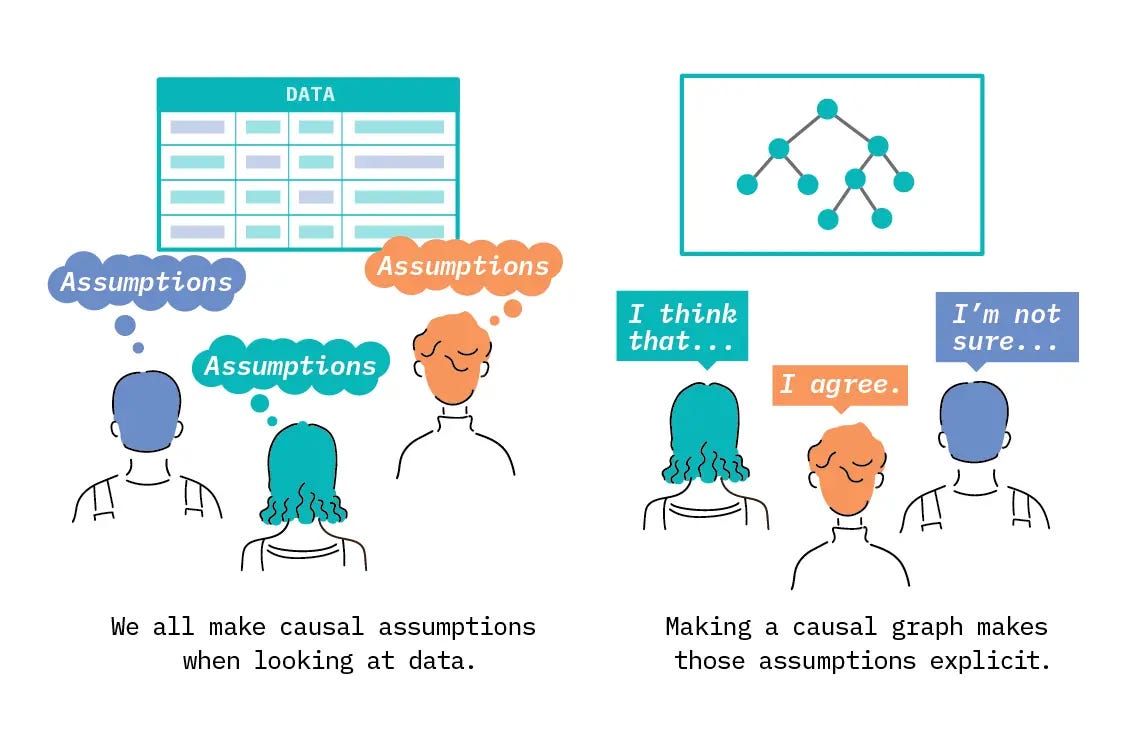
Simpson's paradox (correlation vs causation)
Simpson's Paradox is a statistical phenomenon where a trend or relationship that appears when data is analyzed in smaller groups or subcategories disappears or even reverses when the data is combined as a whole. In simpler terms, it's when the overall pattern contradicts the pattern you see in individual groups.
different overal correlation value in comparison to the data as a whole [7]
In terms of causality, Simpson's Paradox highlights the importance of understanding the underlying causal relationships between variables when interpreting data. It demonstrates that correlations or associations observed in data may be misleading or even entirely reversed when you consider the causal factors at play.
So, when analyzing data, it's important to be aware of Simpson's Paradox and consider the context and subcategories to avoid drawing incorrect conclusions about correlations or trends.
The Solution
Apart from employing Topological Data Analysis for data segmentation, we also provide an additional feature of causal discovery. This not only improves the analyst's experience but also aids in gaining a deeper comprehension of the data interdependencies. Below, we introduce a novel method for presentation of causal discovery results and explaining some technical terms used in causal analysis:
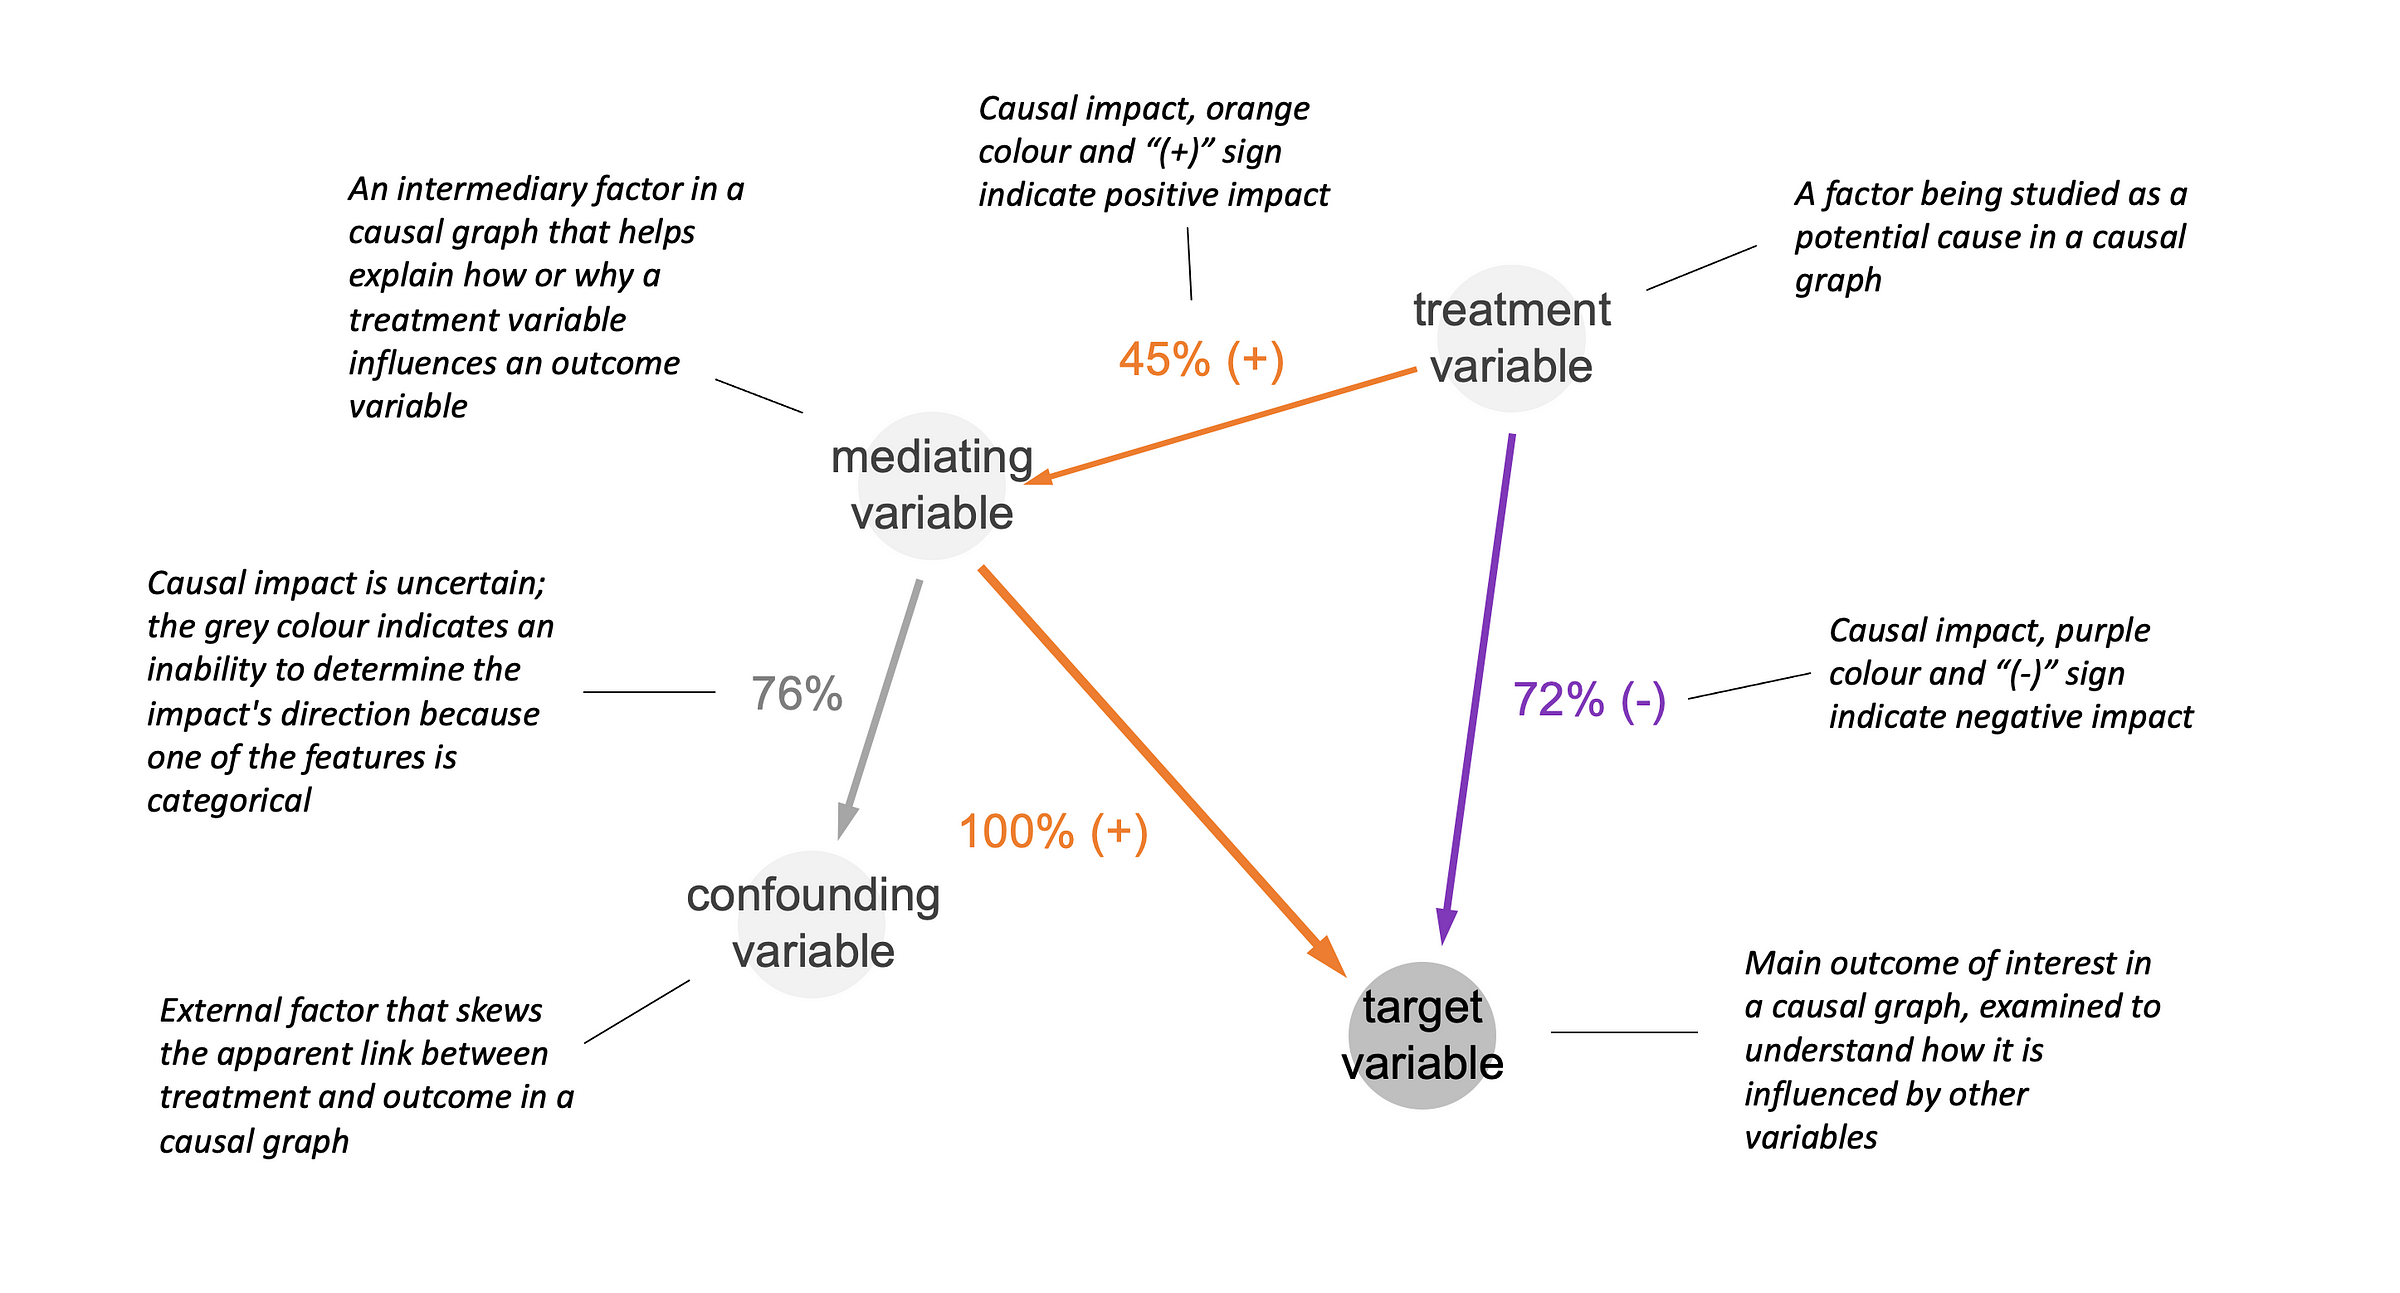
Here is a short overview of different types of variables in causal graph:
- Mediating variables provide a channel through which independent variables affect the dependent variables
- Confounding variables Care extraneous factors that can distort the relationship between the independent and dependent variables.
- Treatment variables are the variables that are manipulated or measured to determine their effect on the dependent variable.
- Target variable is dependent variable or the outcome of interest that researchers are trying to explain or predict through analysis of the treatment variables.
Integrating it with TDA segmentation and enabling users to choose clusters for a focused causal dependency graph is of paramount significance.
Business applications (case studies)
Let's review some toy examples to understand the benefits of the causal discovery.
Social data analysis (social network)
Similar to numerous other online services, social networks are making significant efforts to enhance user engagement. Beyond segmentation, conducting a causal analysis of the connections between user actions and outcomes greatly contributes to a deeper understanding.
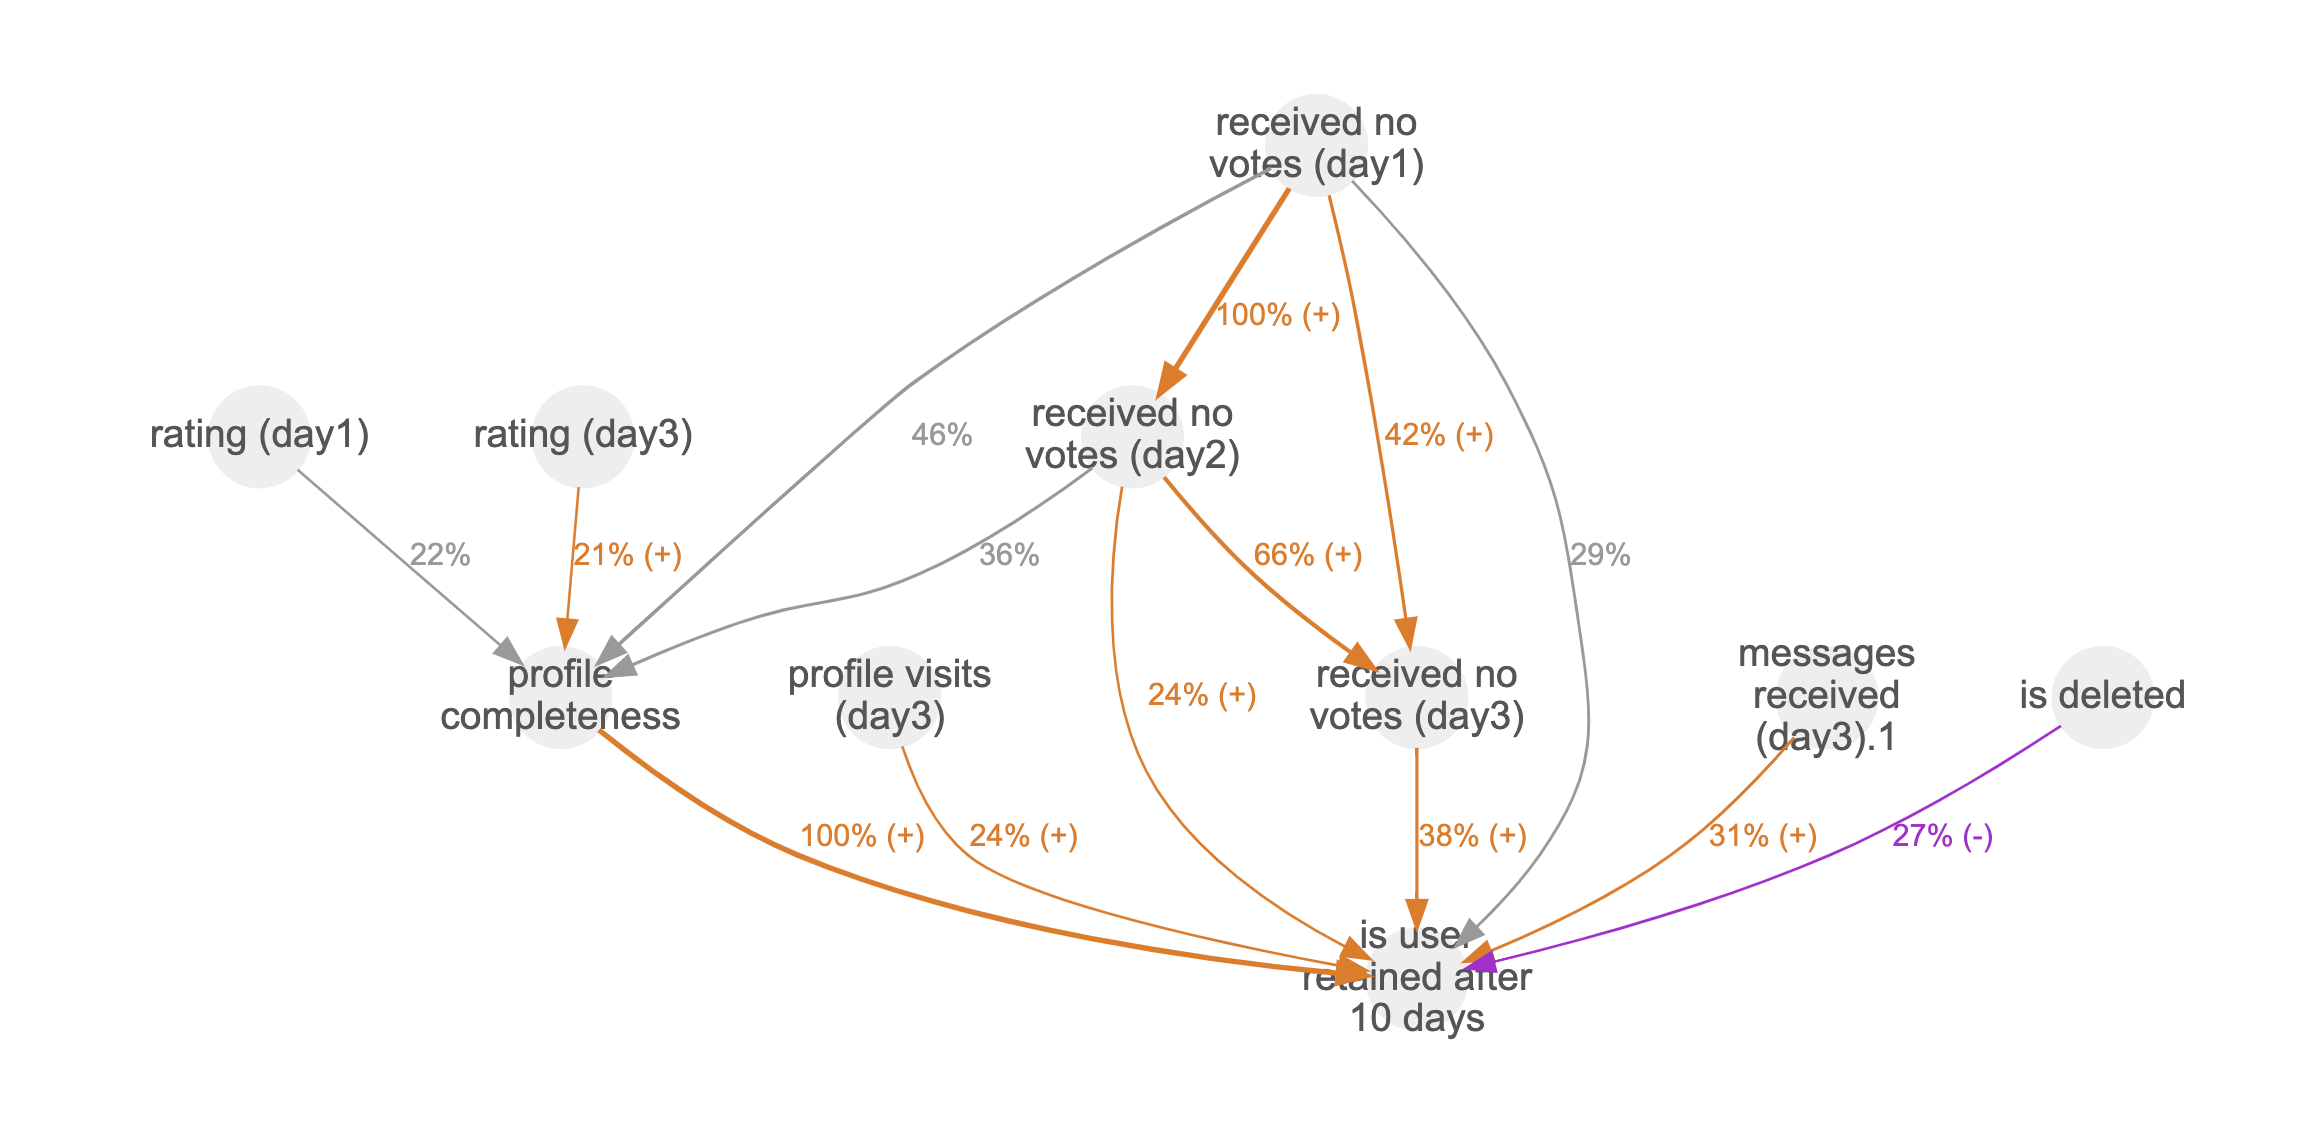
In the example above, the target parameter is the "user retention after 10 days", a key metric for the company. This graph not only indicates that "profile completeness" is the foremost factor affecting the retention metric but also underscores the substantial influence of user ratings on the first day and third day ("rating (day1)", "rating (day3)") on the "profile completeness" parameter.
Social data analysis (census data)
The Adult Census dataset [2] is a popular choice for case studies in data science. It is well-designed and provides a great example of a causal discovery use case. The dataset can be used to predict whether an individual's income exceeds $50,000 per year, based on a variety of demographic and socioeconomic factors.
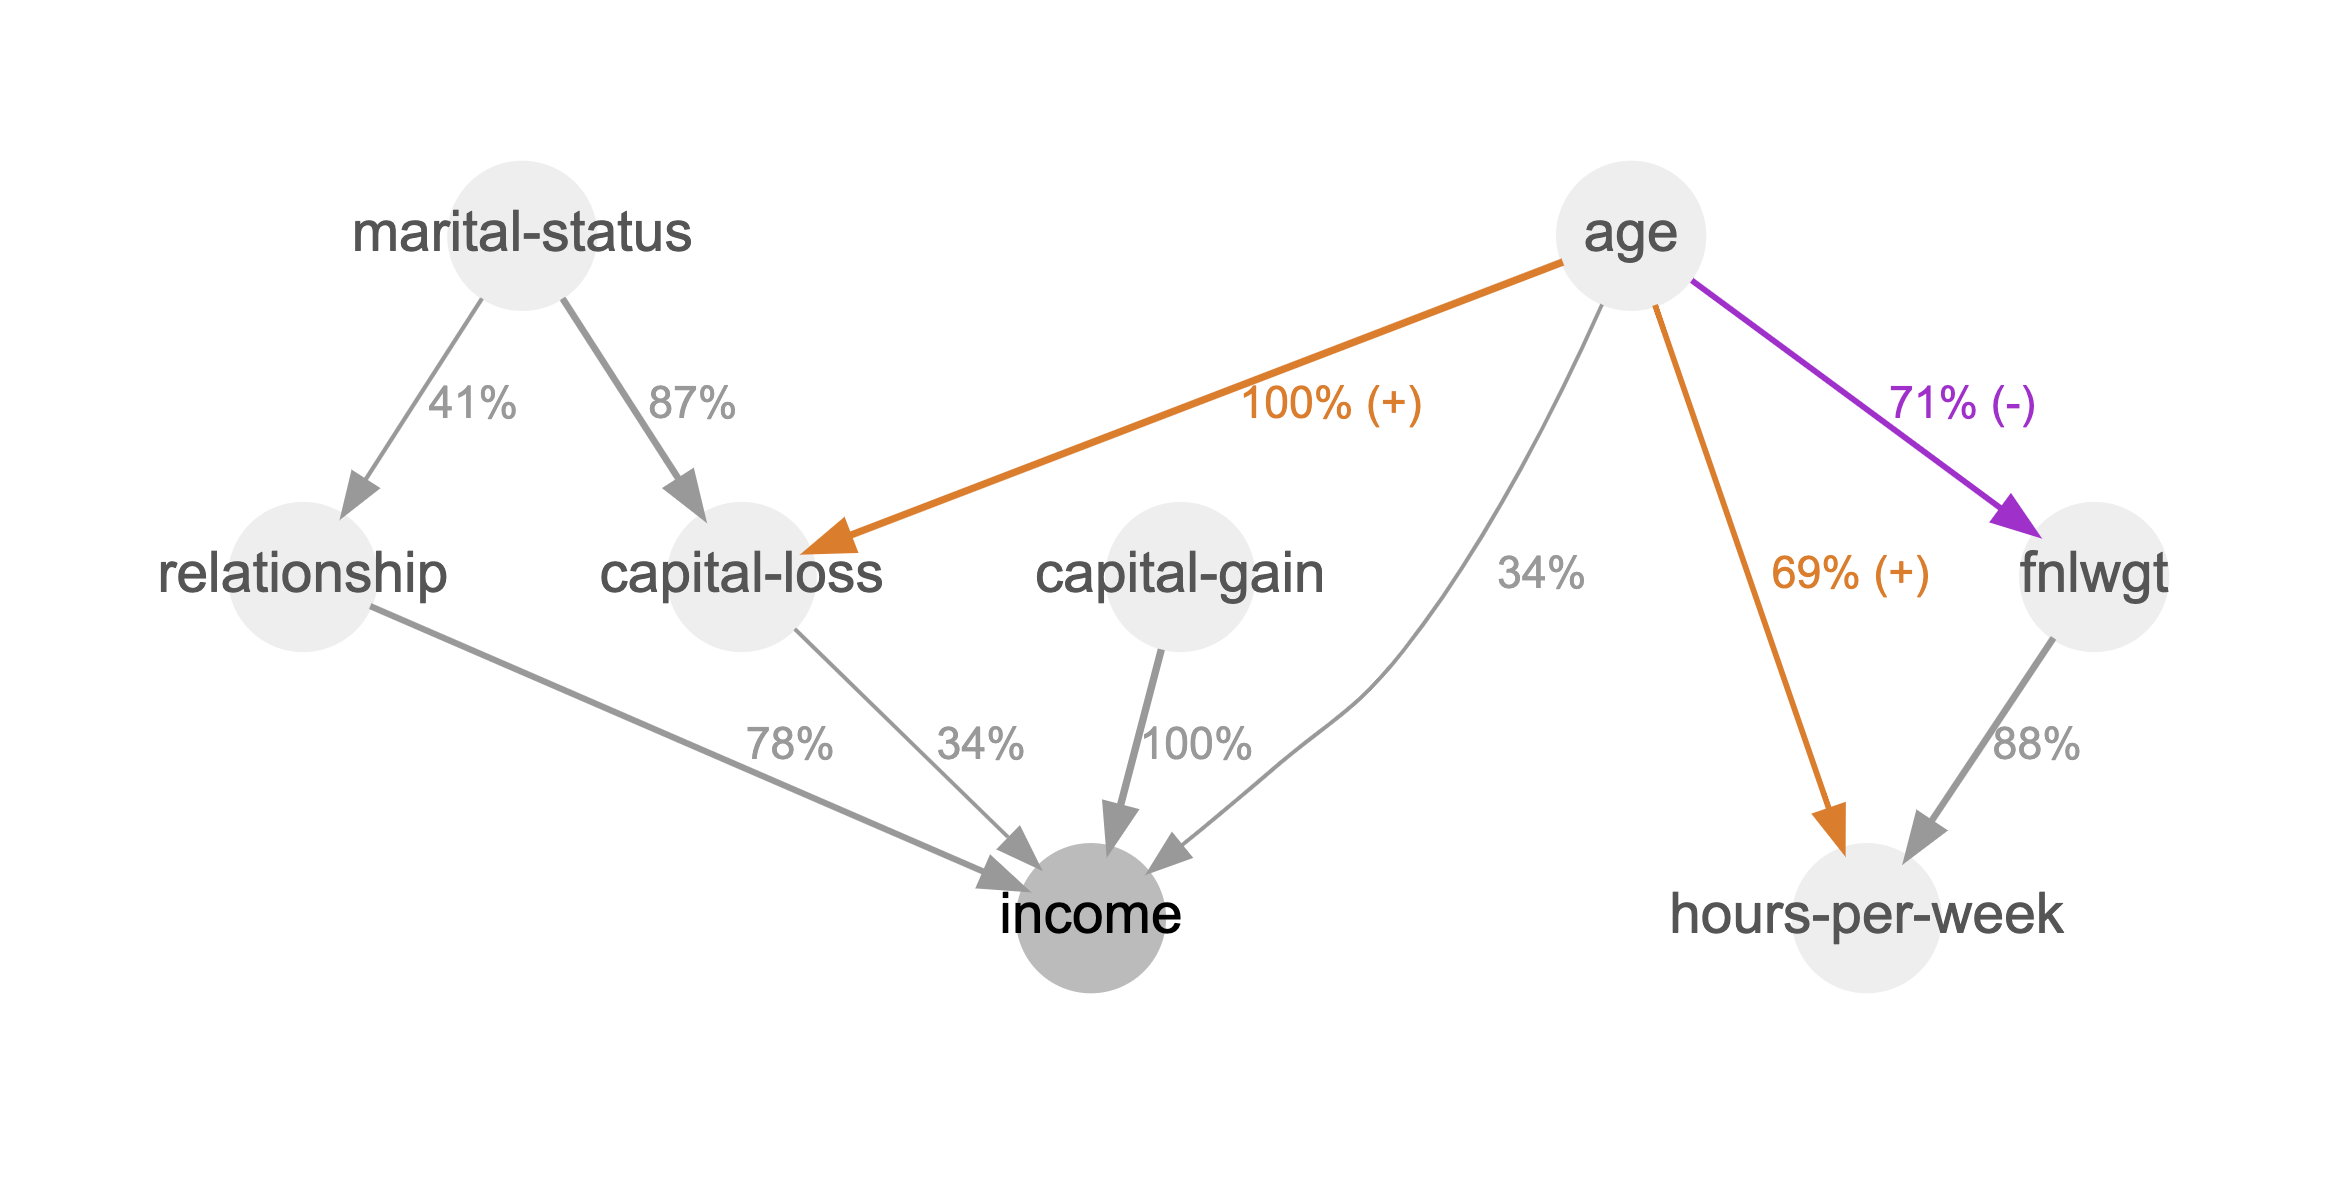
In this example, we can see that "capital gain" is the strongest overall predictor of higher income. This is to be expected, as capital gain is essentially a measure of how much money someone has made from investing. "Age" and "marital status" are both important predictors of income, even after controlling for capital gain. This suggests that these factors may play a role in determining how people invest their money, or how they are able to save money in the first place. "hours-per-week", on the other hand, is not a significant predictor of income after controlling for capital gain. This suggests that there are other factors, such as education or skills, that are more important for determining income.
Engineering
In this case study, we will use TDA and causal discovery to analyze the Auto-mpg dataset [3]. This dataset contains information on 398 different cars, including their engine parameters and fuel consumption. We will use TDA to identify the most important engine parameters for fuel consumption. We will then use causal discovery to identify the relationships between these parameters.
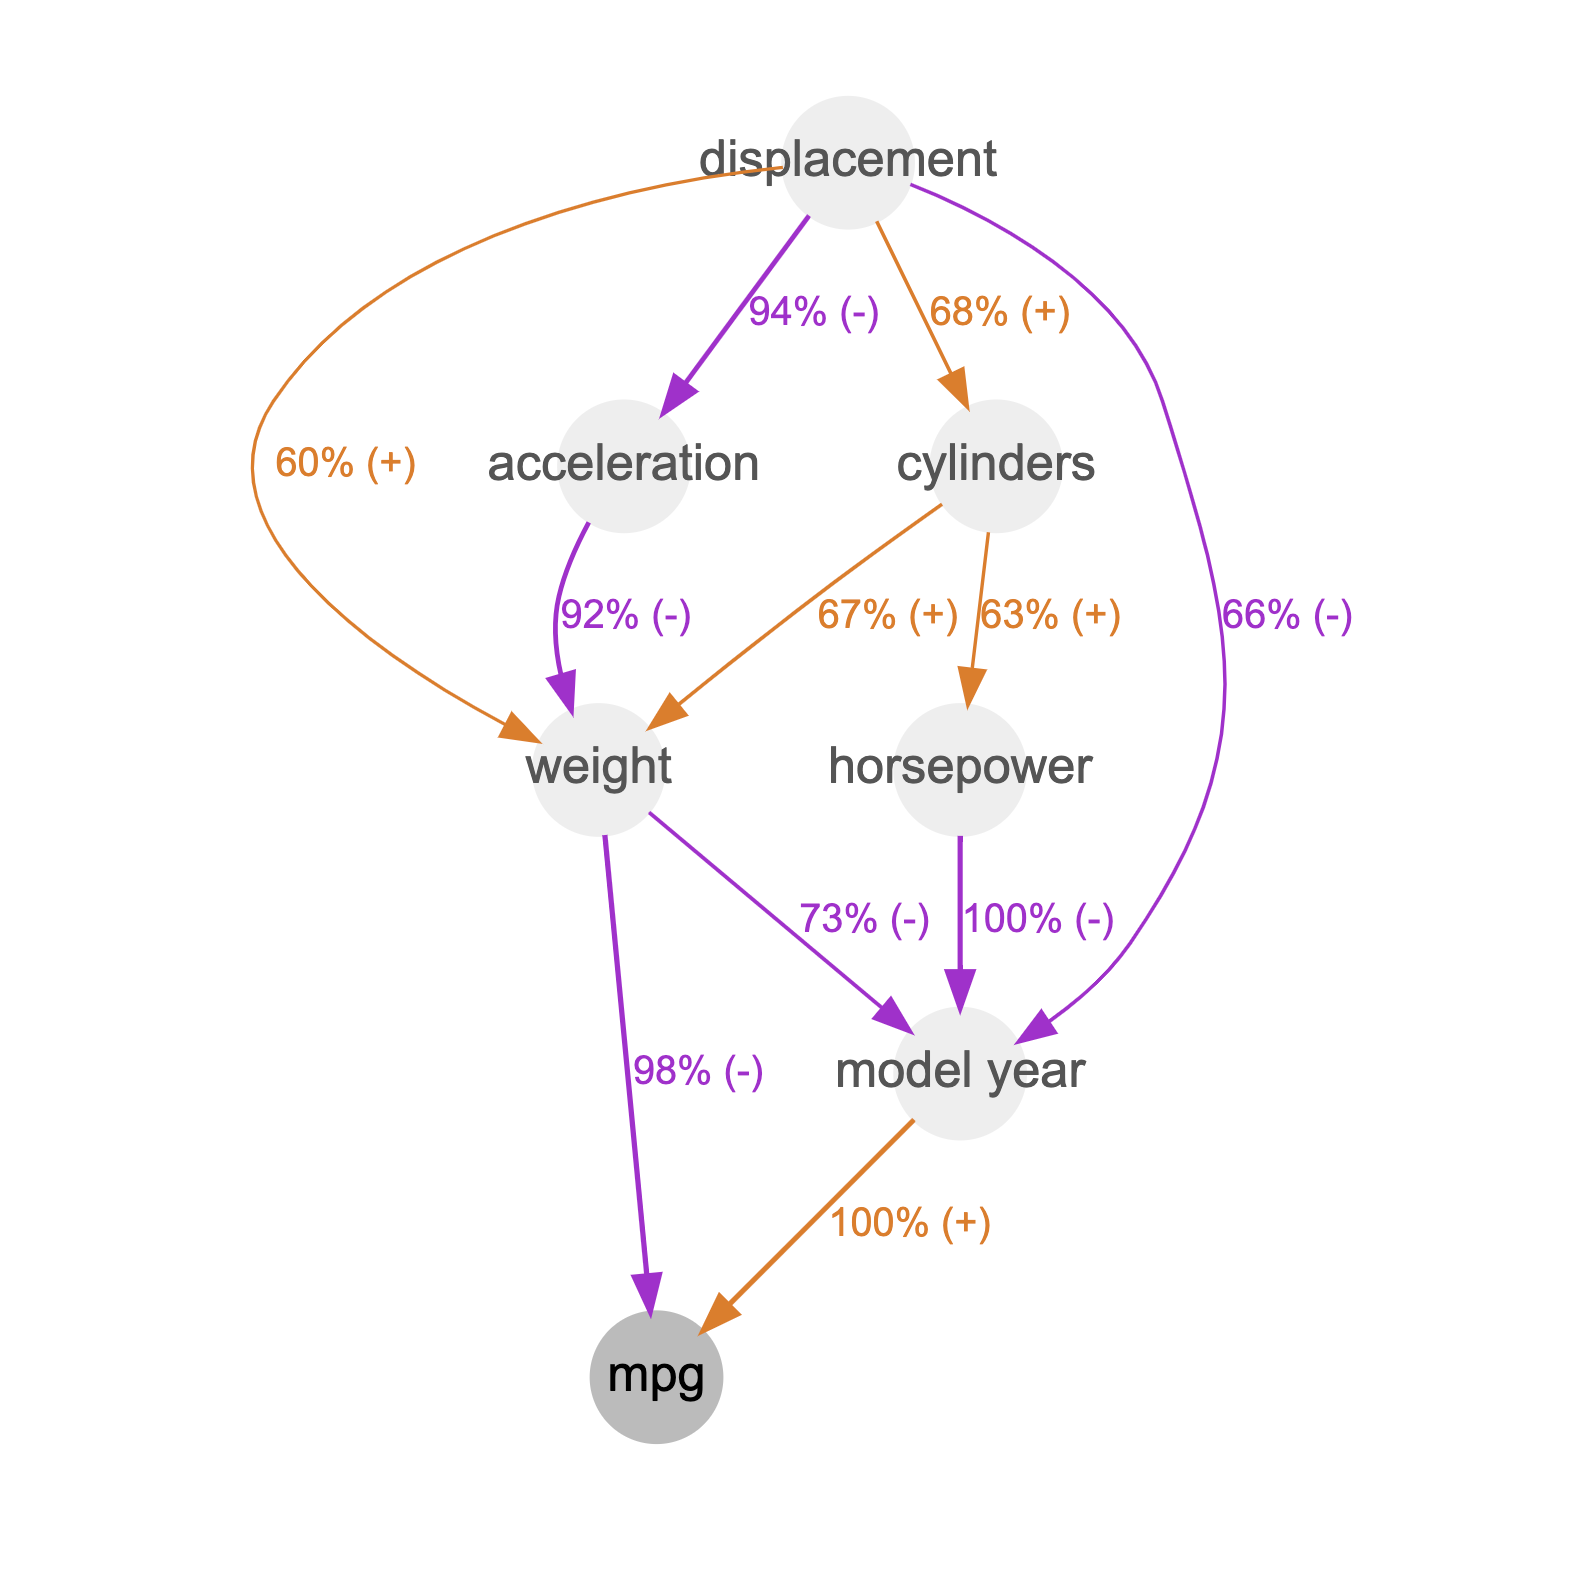
Our results show that the most important engine parameters for fuel consumption are the "model year" and the "weight". We also found that there is a complex relationship between parameters. For example, the number of cylinders has a negative impact on fuel consumption, but this impact is weaker for cars with a larger displacement.
These results can be used by engineers to improve the fuel efficiency of cars. For example, engineers could design cars with a smaller displacement or with a different number of cylinders. They could also use these results to troubleshoot problems with fuel consumption.
Supply and Demand analysis
In this case study, we will use the Bike Sharing Dataset [4] to analyze the supply and demand of bike sharing services. This dataset contains information on the hourly and daily count of rental bikes between the years 2011 and 2012 in the Capital bike share system. We will use this data to identify the factors that affect the demand for bike sharing services, such as the time of day, the weather, and the season.
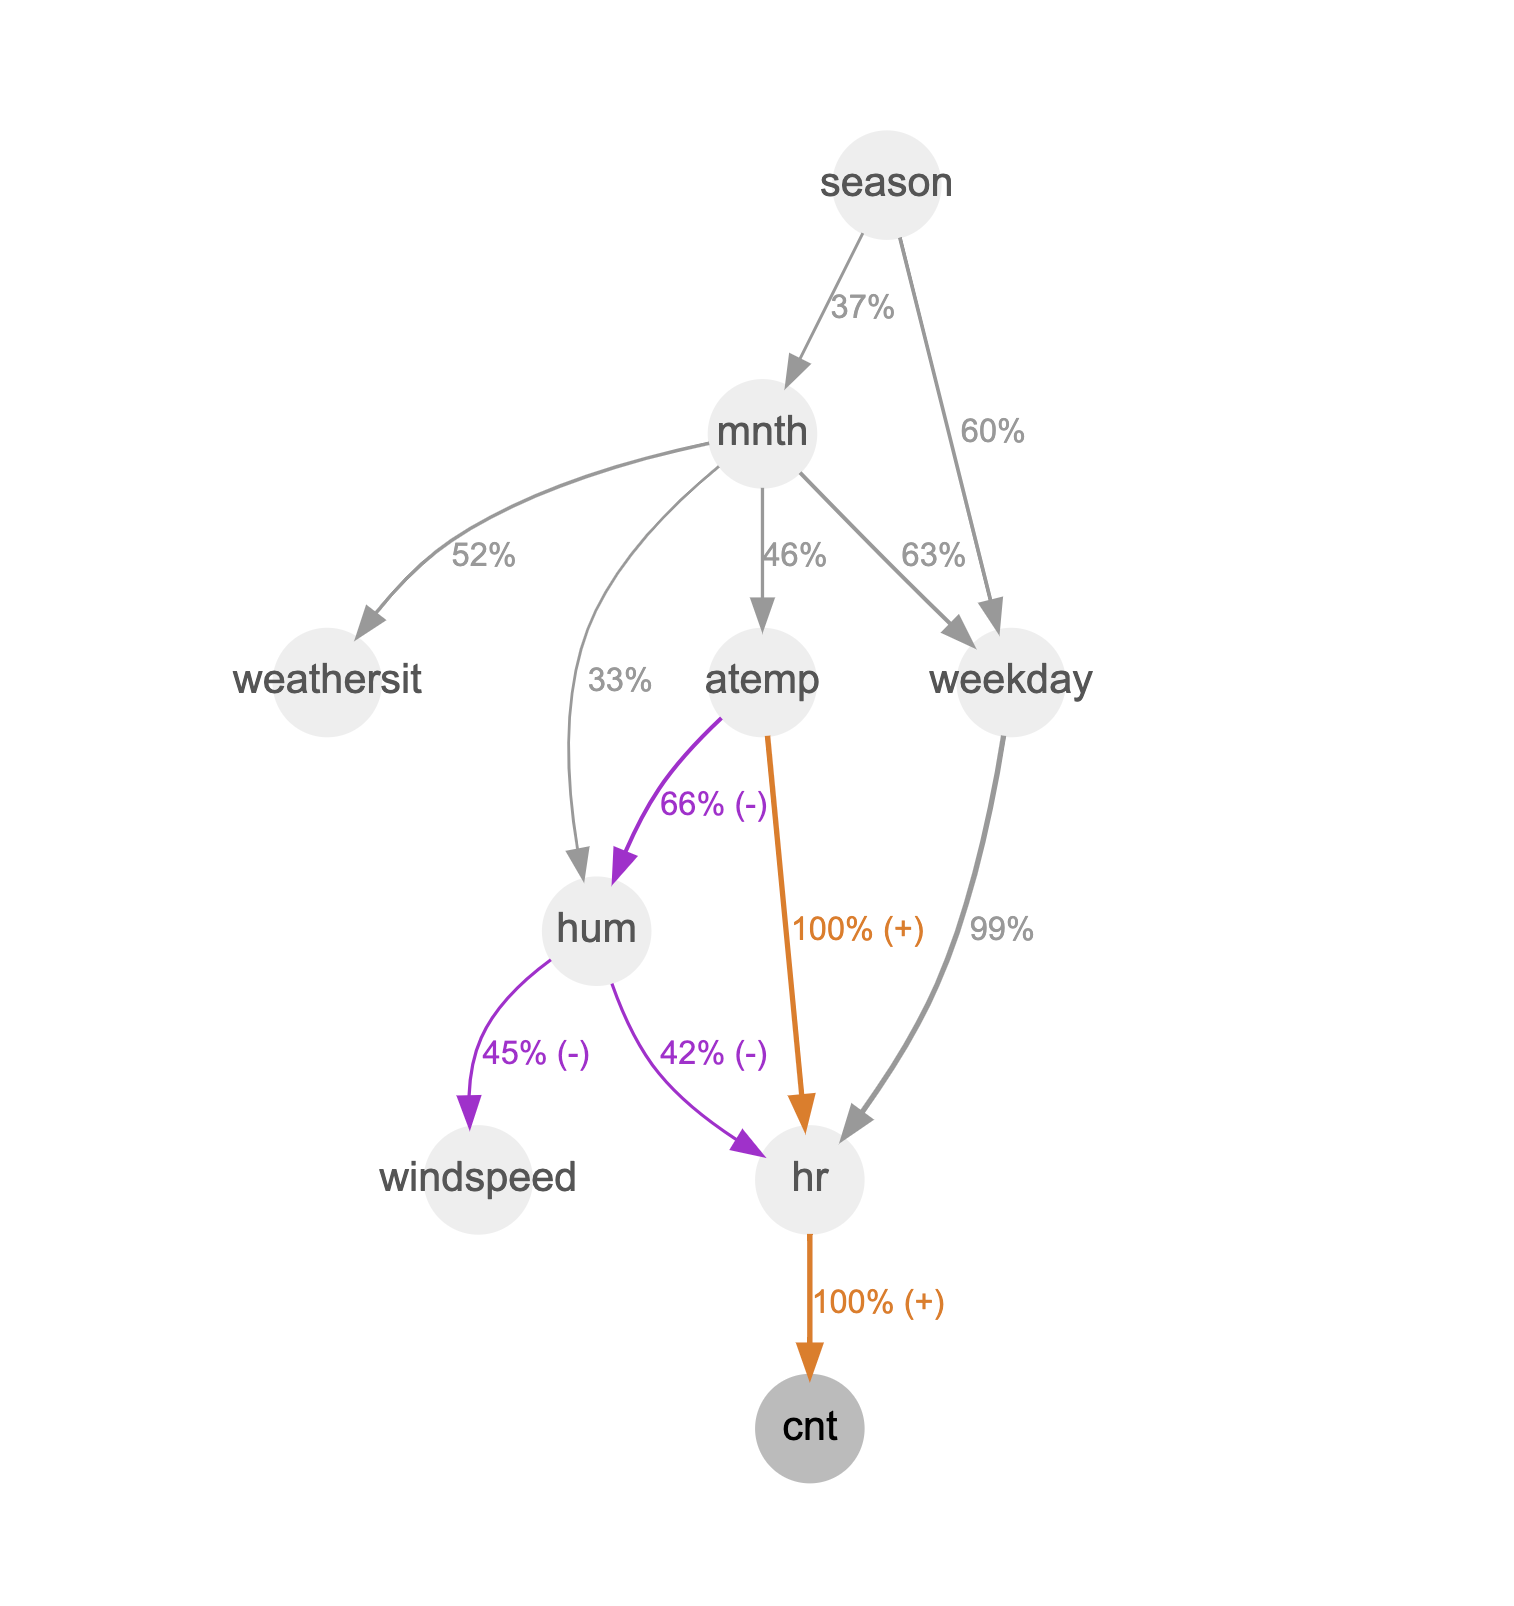
Our results show that the hour of the day "hr" is the biggest predictor of the demand for bike sharing services. The demand is highest during the morning and evening rush hours, and it is lowest during the night. The weather also has a significant impact on the demand for bike sharing services. The demand is higher on sunny days and lower on rainy days. The season also has a small impact on the demand for bike sharing services. The demand is higher in the summer and lower in the winter.
Other factors, such as the day of the week and the location, also have a small impact on the demand for bike sharing services. However, these factors have an impact of less than 30%, which is our current threshold for the graph.
These results can be used to improve the management of bike sharing systems. For example, bike sharing operators can use this data to allocate bikes more efficiently to meet the demand. They can also use this data to forecast the demand for bike sharing services, which can help them to plan their operations.
Tree-based approach for causal discovery
Boosting trees are a powerful tool in the realm of causal discovery, enabling the estimation of causal effects in complex systems. By leveraging predictive modeling techniques, boosting trees can uncover causal relationships between variables, allowing researchers to identify the impacts of certain factors on outcomes of interest.
On the other hand, Topological Data Analysis (TDA) complements this approach by offering insights into potential causal pathways and mechanisms underlying observed relationships. Through the analysis of topological structures in data, TDA helps researchers visualize and comprehend the intricate interplay between variables, shedding light on how causality may be propagated through a network of interconnected elements. Together, boosting trees and TDA offer a comprehensive approach to unraveling causal relationships, from estimating effects to understanding the intricate pathways through which these effects are propagated.
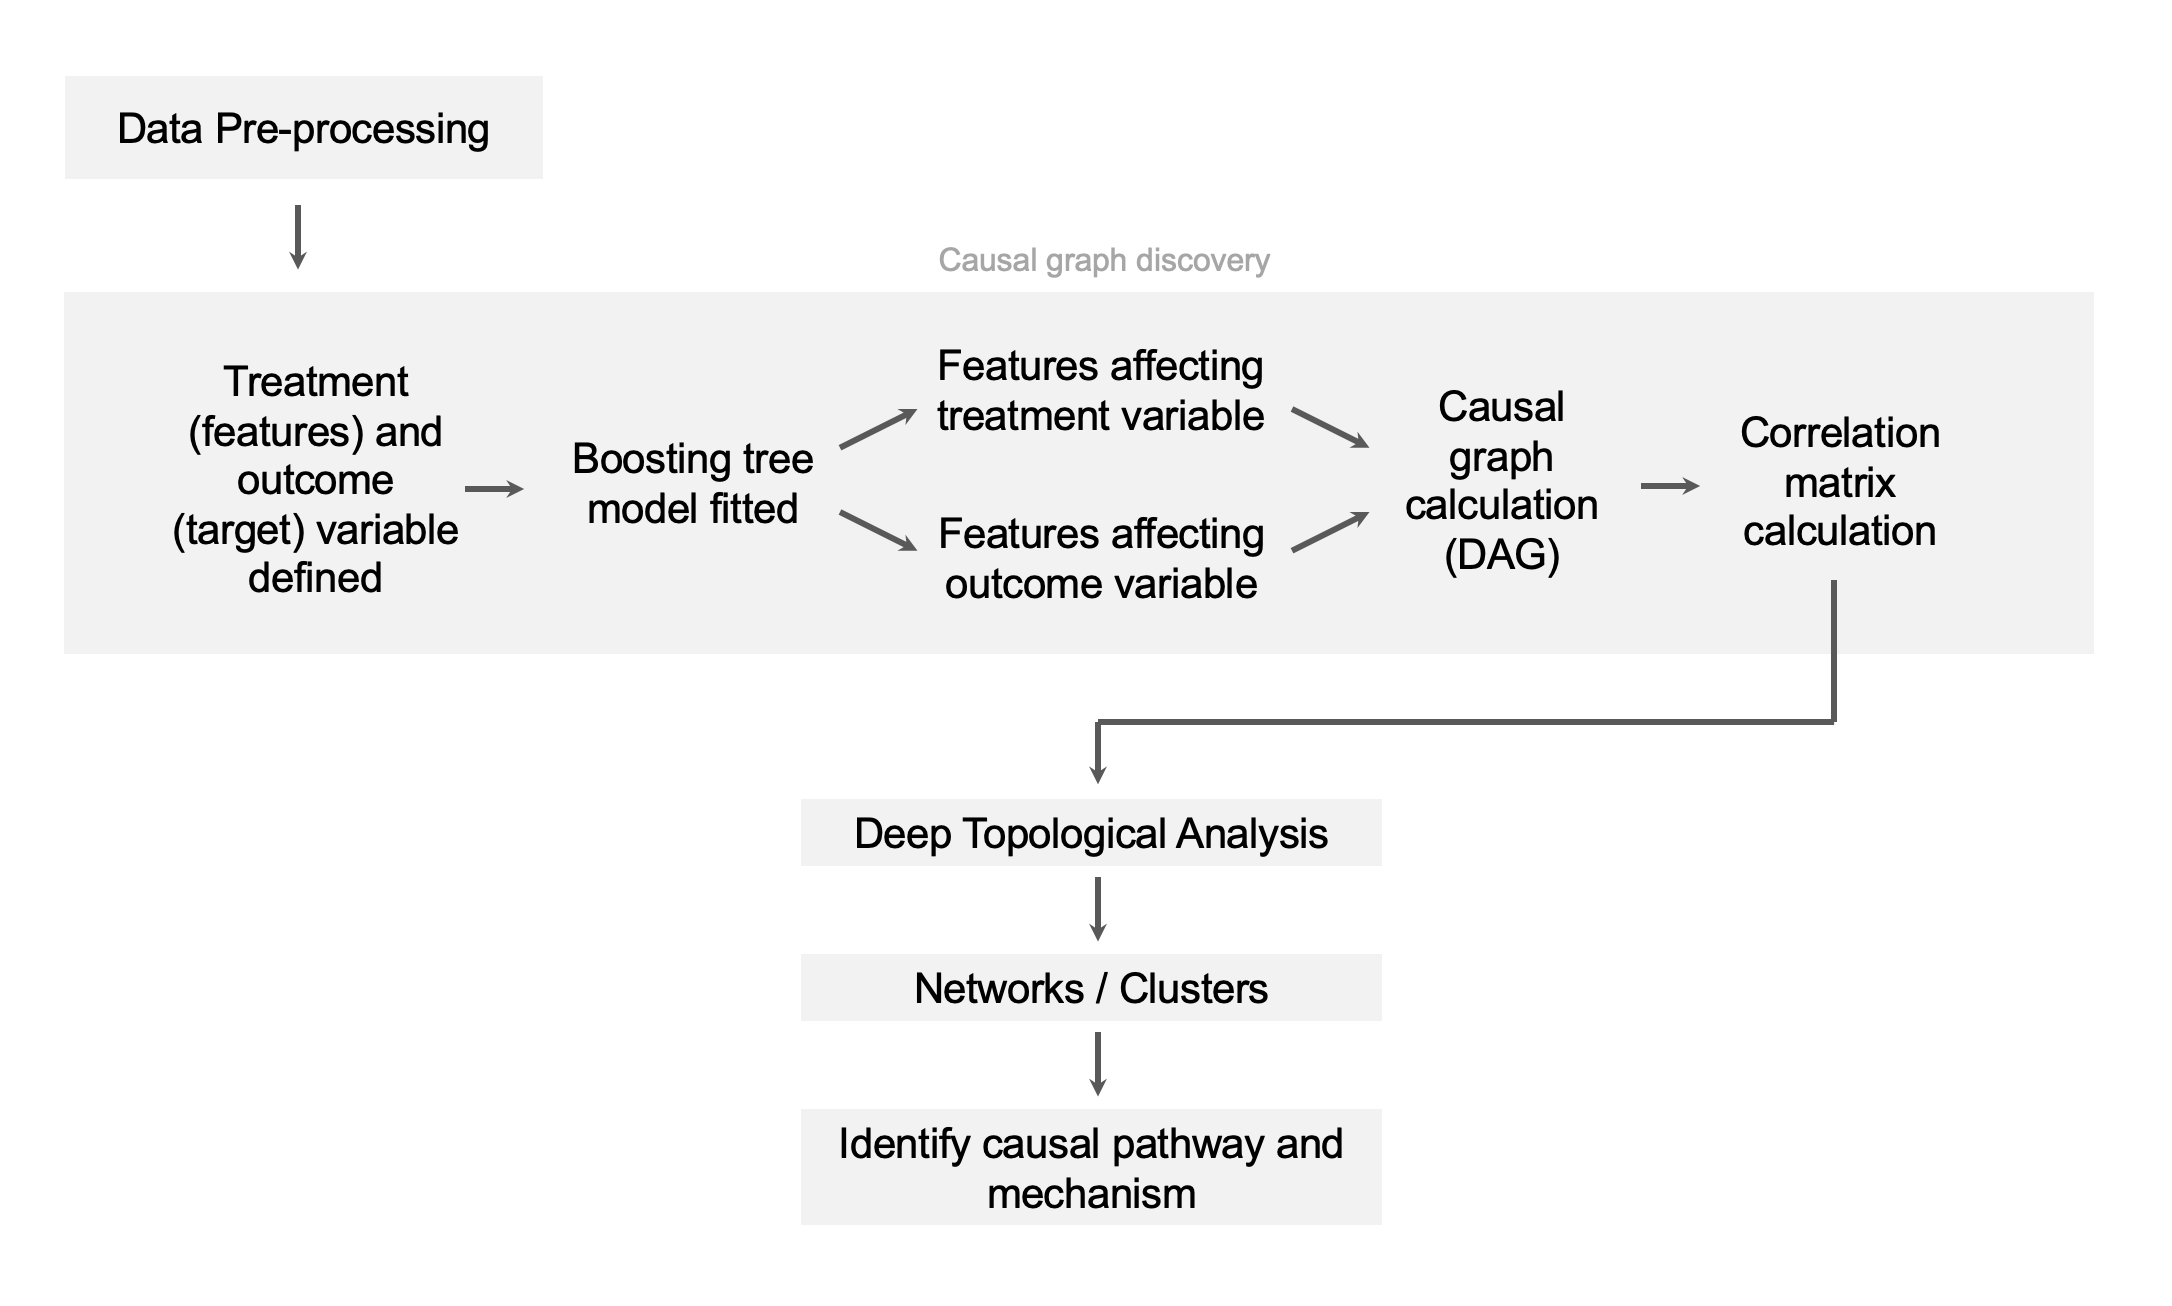
It is important to note that boosting trees cannot be used alone to indicate causal relationships between features. Our unique approach combines boosting trees with topological data analysis (TDA), which helps to uncover hidden patterns in complex datasets. These patterns can then be explained by the boosting trees through the use of dependency scores.
Comparison with traditional causal discovery algorithms
We're using boosting trees for causal discovery here. The main distinguishing feature of boosting trees is they need a target variable, while traditional algorithms like PC (Peter-Clark) or LiNGAM (Linear Non-Gaussian Acyclic Model) don't. However, it is still worth comparing our approach and understand their strengths and weaknesses.
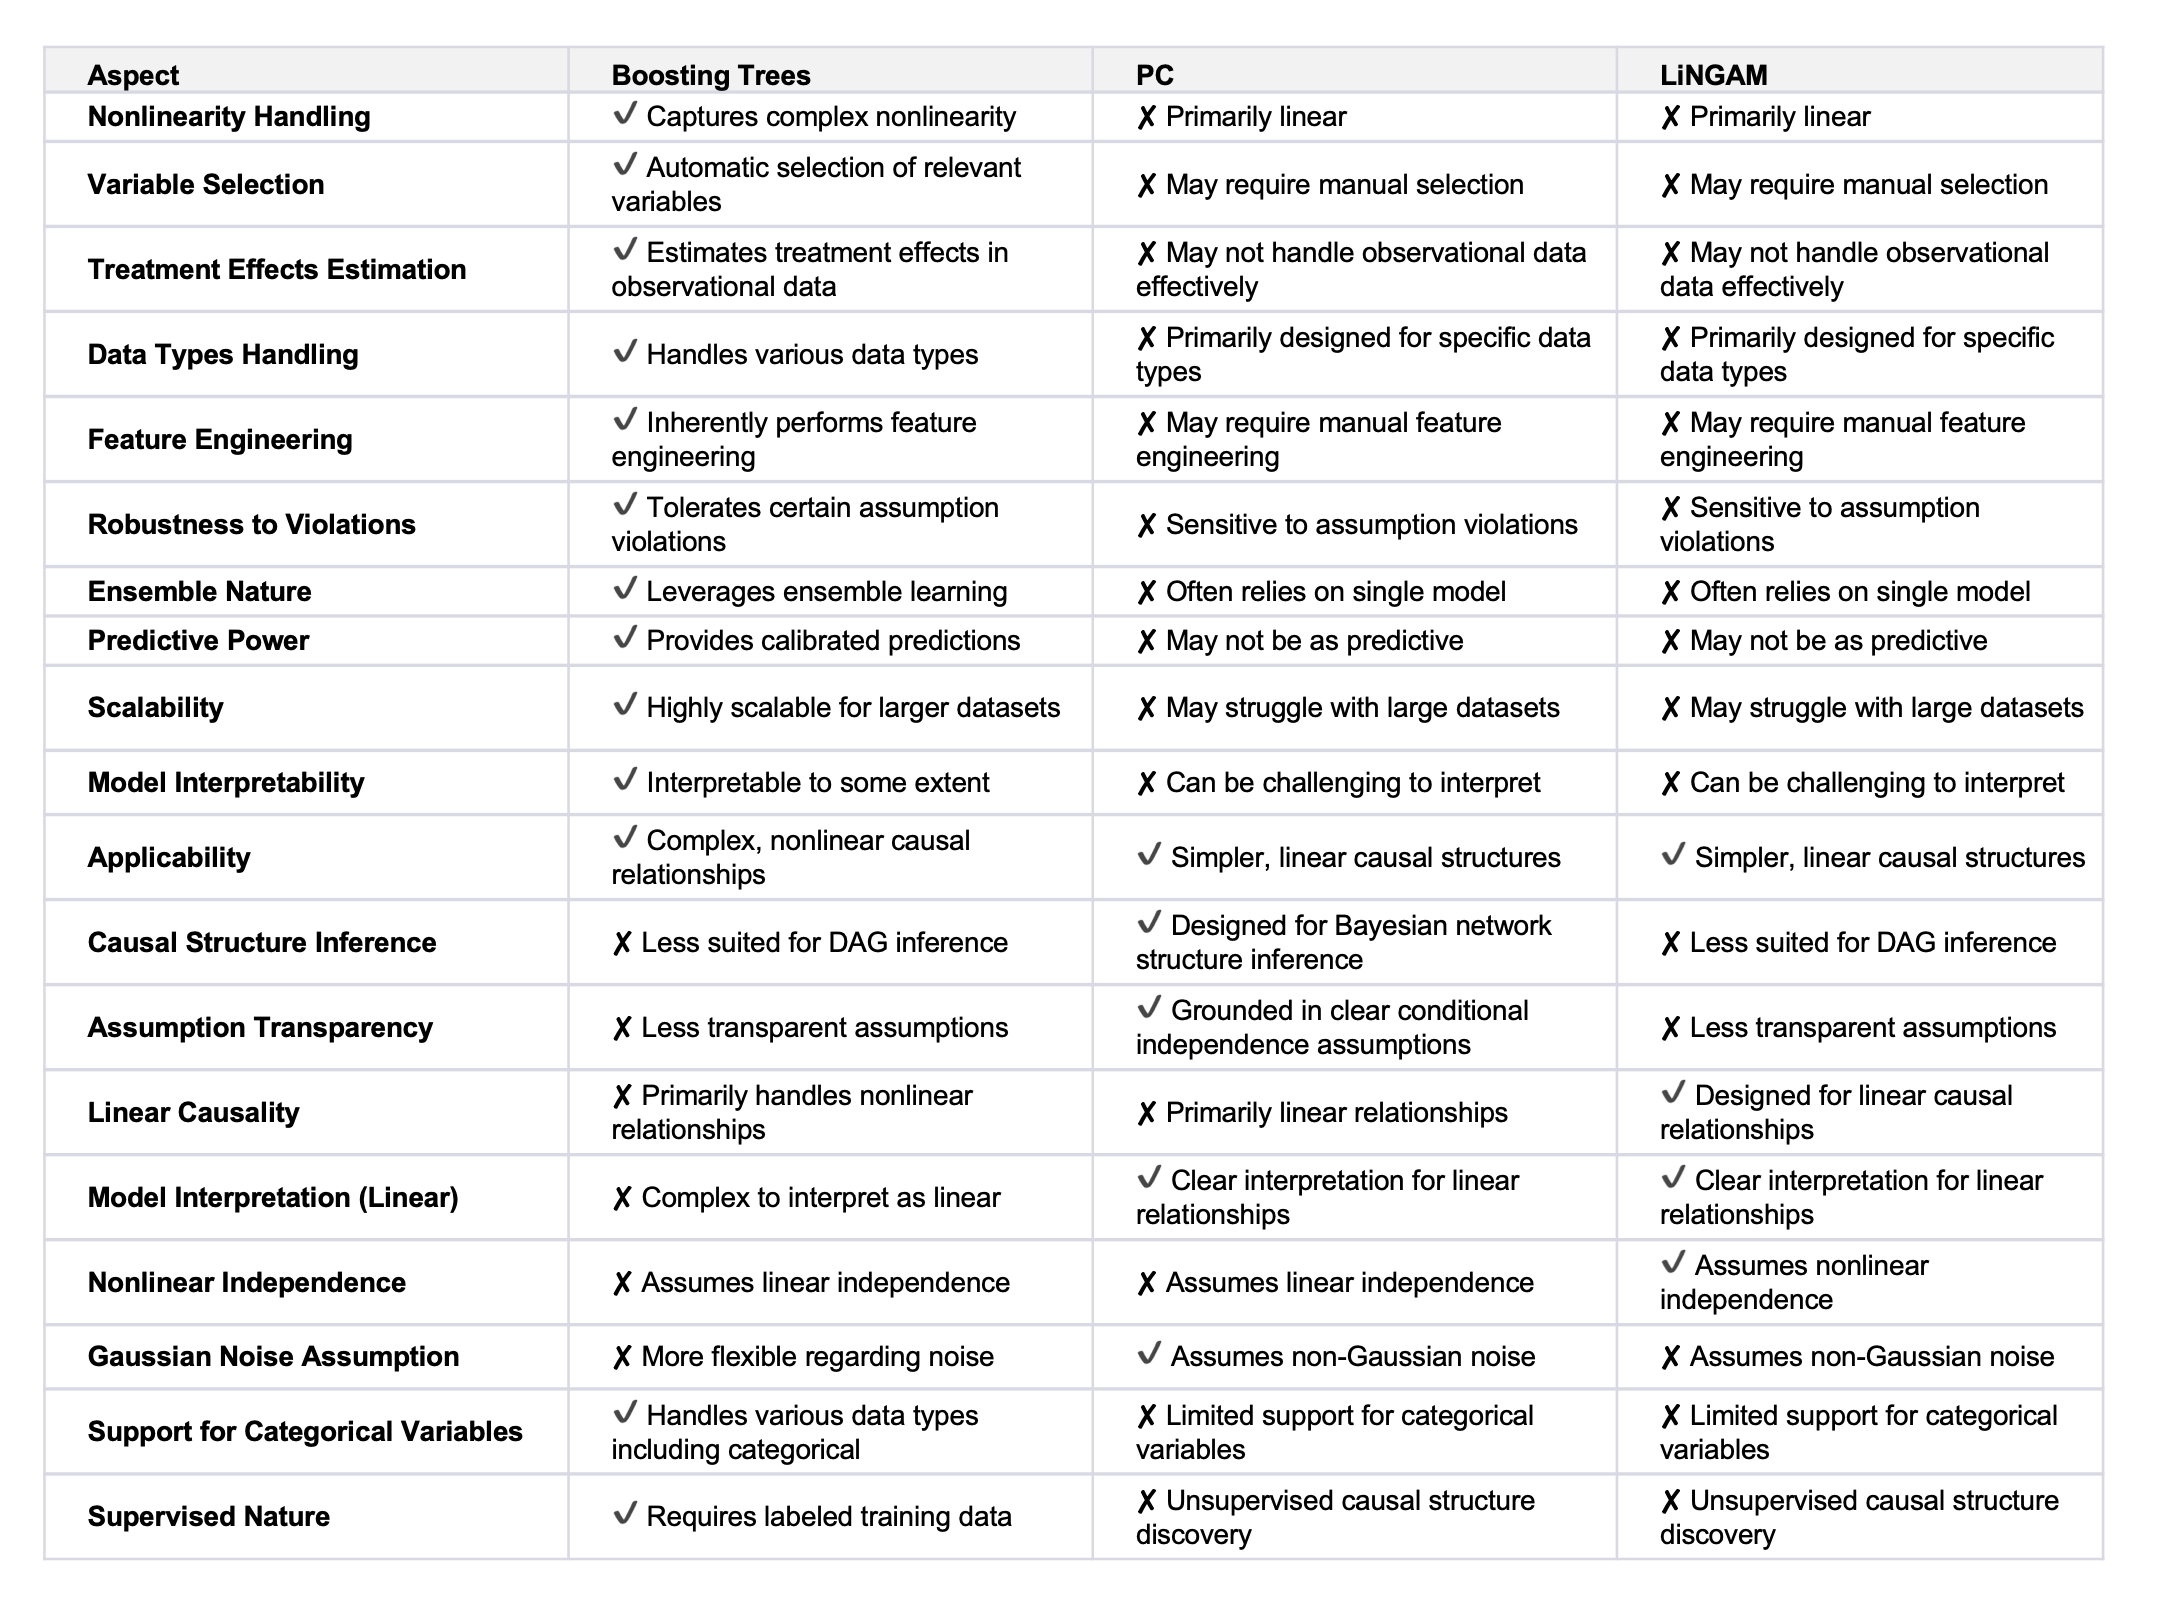
Let's try to compare key differences between boosting trees approach, PC and LiNGAM:
- Supervised Nature: Boosting trees find guidance in nature's supervision, necessitating a supplied target variable, whereas PC and LiNGAM operate unsupervised, autonomously extracting the target variable from the dataset.
- Predictive Power: Boosting trees generate predictions that are well-calibrated and can be useful for both causal discovery and prediction tasks, offering a dual advantage over algorithms that focus solely on causality.
- Nonlinearity Handling: Boosting trees can capture complex nonlinear relationships between variables, which is often the case in real-world causal systems. This allows them to model intricate cause-and-effect patterns that may be missed by linear methods like PC and LiNGAM.
- Flexibility: Boosting trees can handle a mix of continuous, categorical, and discrete variables, making them more versatile for analyzing diverse data types commonly encountered in causal discovery tasks. While PC and LinGAM mostly work with continuous variables it is worthwhile to note that there are modifications to LinGAM which support categorical variables. However, these modified LinGAM approaches are shown to lack robustness.
- Scalability: Boosting algorithms like Gradient Boosting and XGBoost are highly scalable and can handle larger datasets efficiently, which is important for causal discovery in contemporary big data settings.
Below is an attempt to compare these approaches in a table:
We understand that the boosting trees approach is not perfect. However, for most of the use cases which we examined so far with our collaborators, this approach appears to be the best option.
Causal Discovery + Deep Topological Analysis
The true power of causal discovery comes from combining it with deep topological data analysis (TDA). TDA is a mathematical technique for analyzing data that is based on the topological properties of the data. Causal discovery is a statistical technique for determining causal relationships between variables.
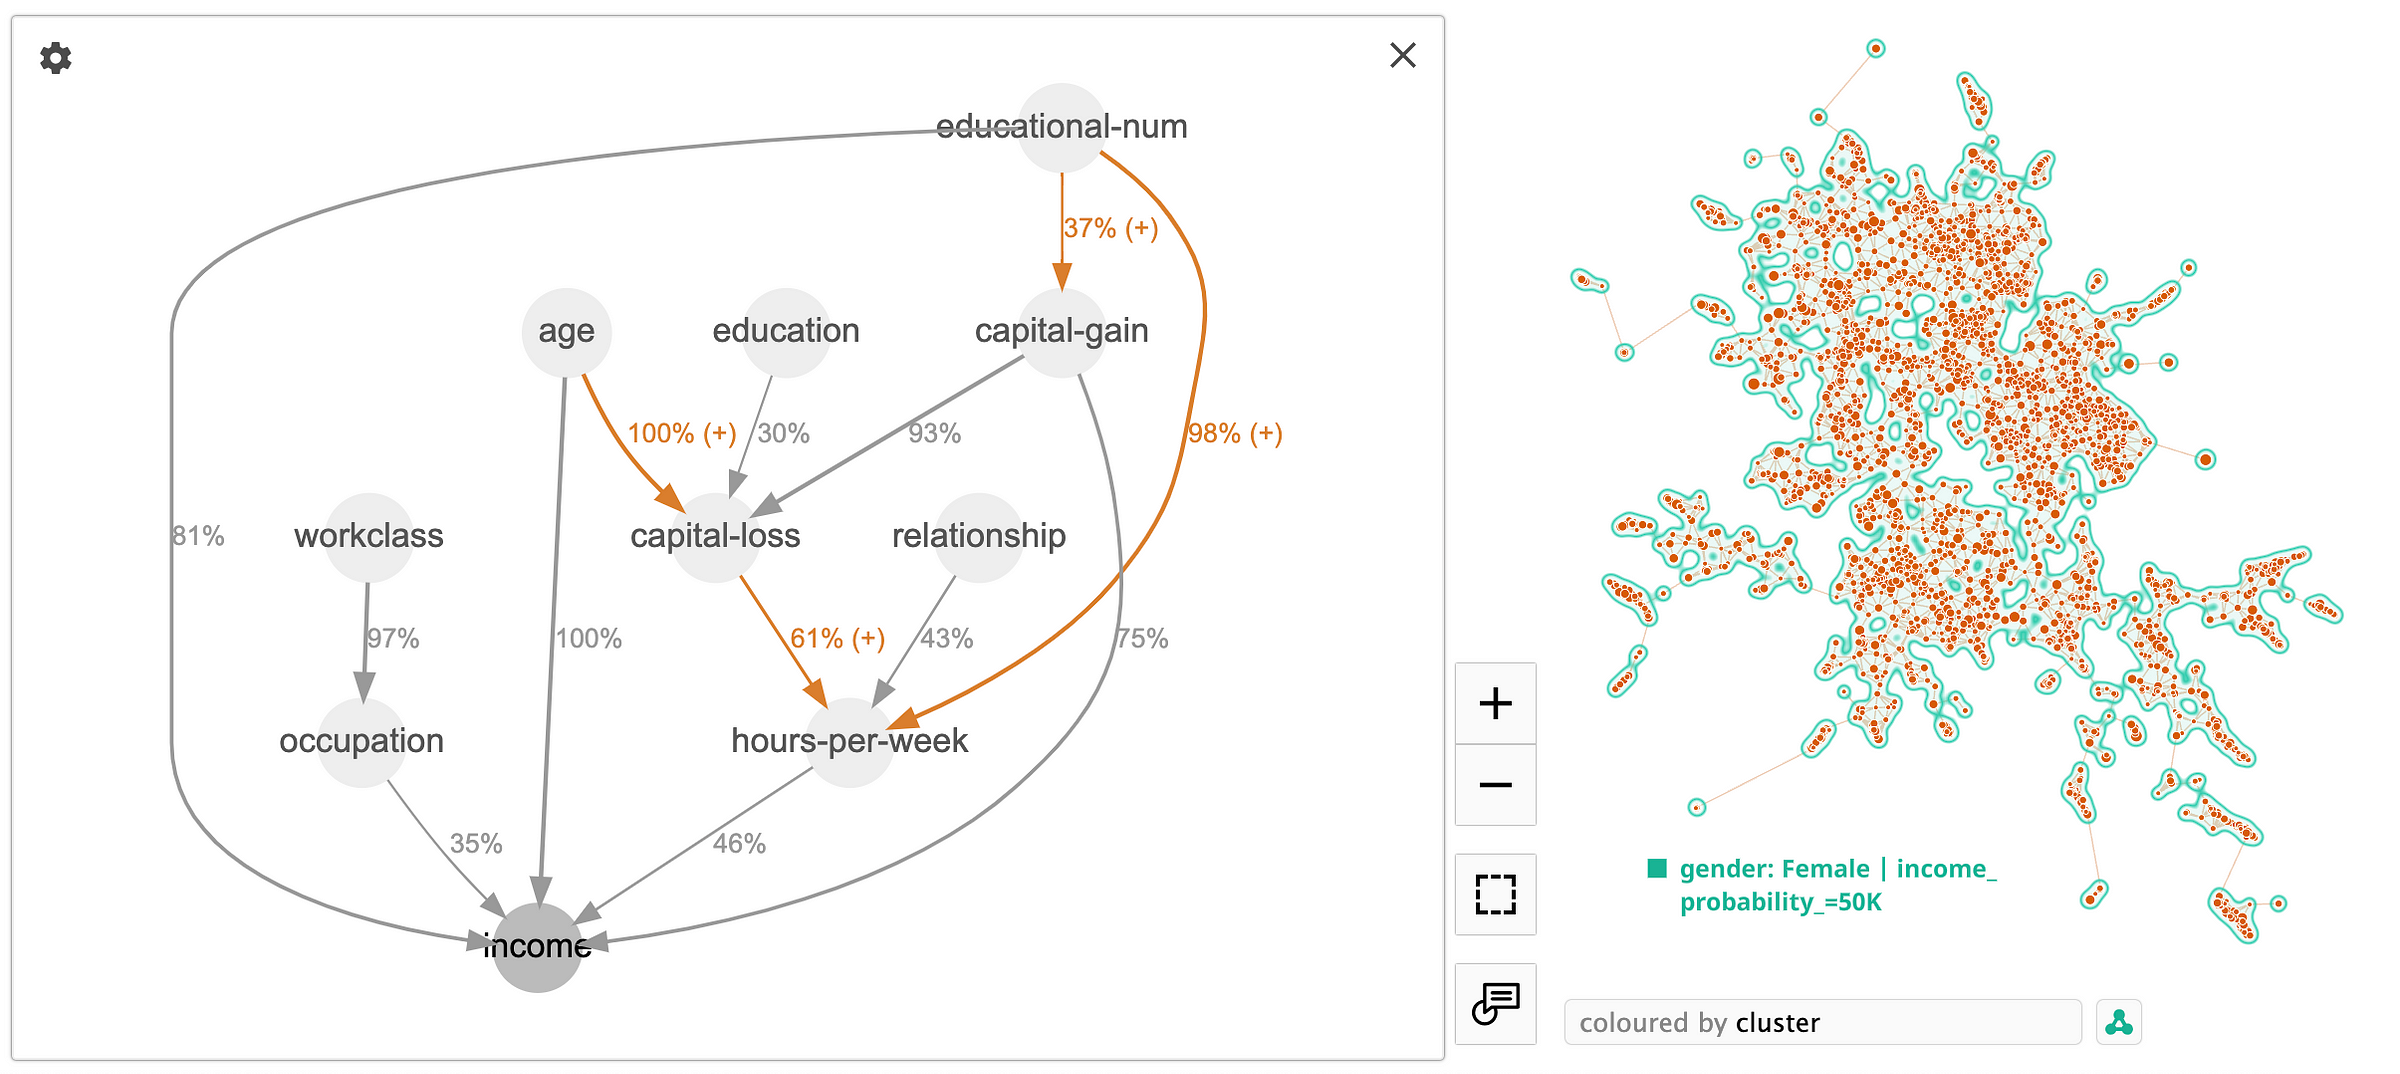
By combining these two techniques, we can generate causal graphs for selected clusters or groups of clusters. This allows us to understand the specific dependencies within each cluster.
In this case let's use Adult Census [2] dataset we used before, and compare causal graph for two different clusters. Below is the cluster for single female workers, and their income is mostly determined by "age" rather than "capital-gain". "Hours-per-week" are getting much more impoartance in this case as well.
In contrast, we have another cluster representing executive and managerial positions, where the significance of "age" and "hours-per-week" in determining income is diminished. In this scenario, "capital-gain" takes precedence as the primary predictor for income, with "age" being a secondary factor, carrying only half the importance of "capital-gain".
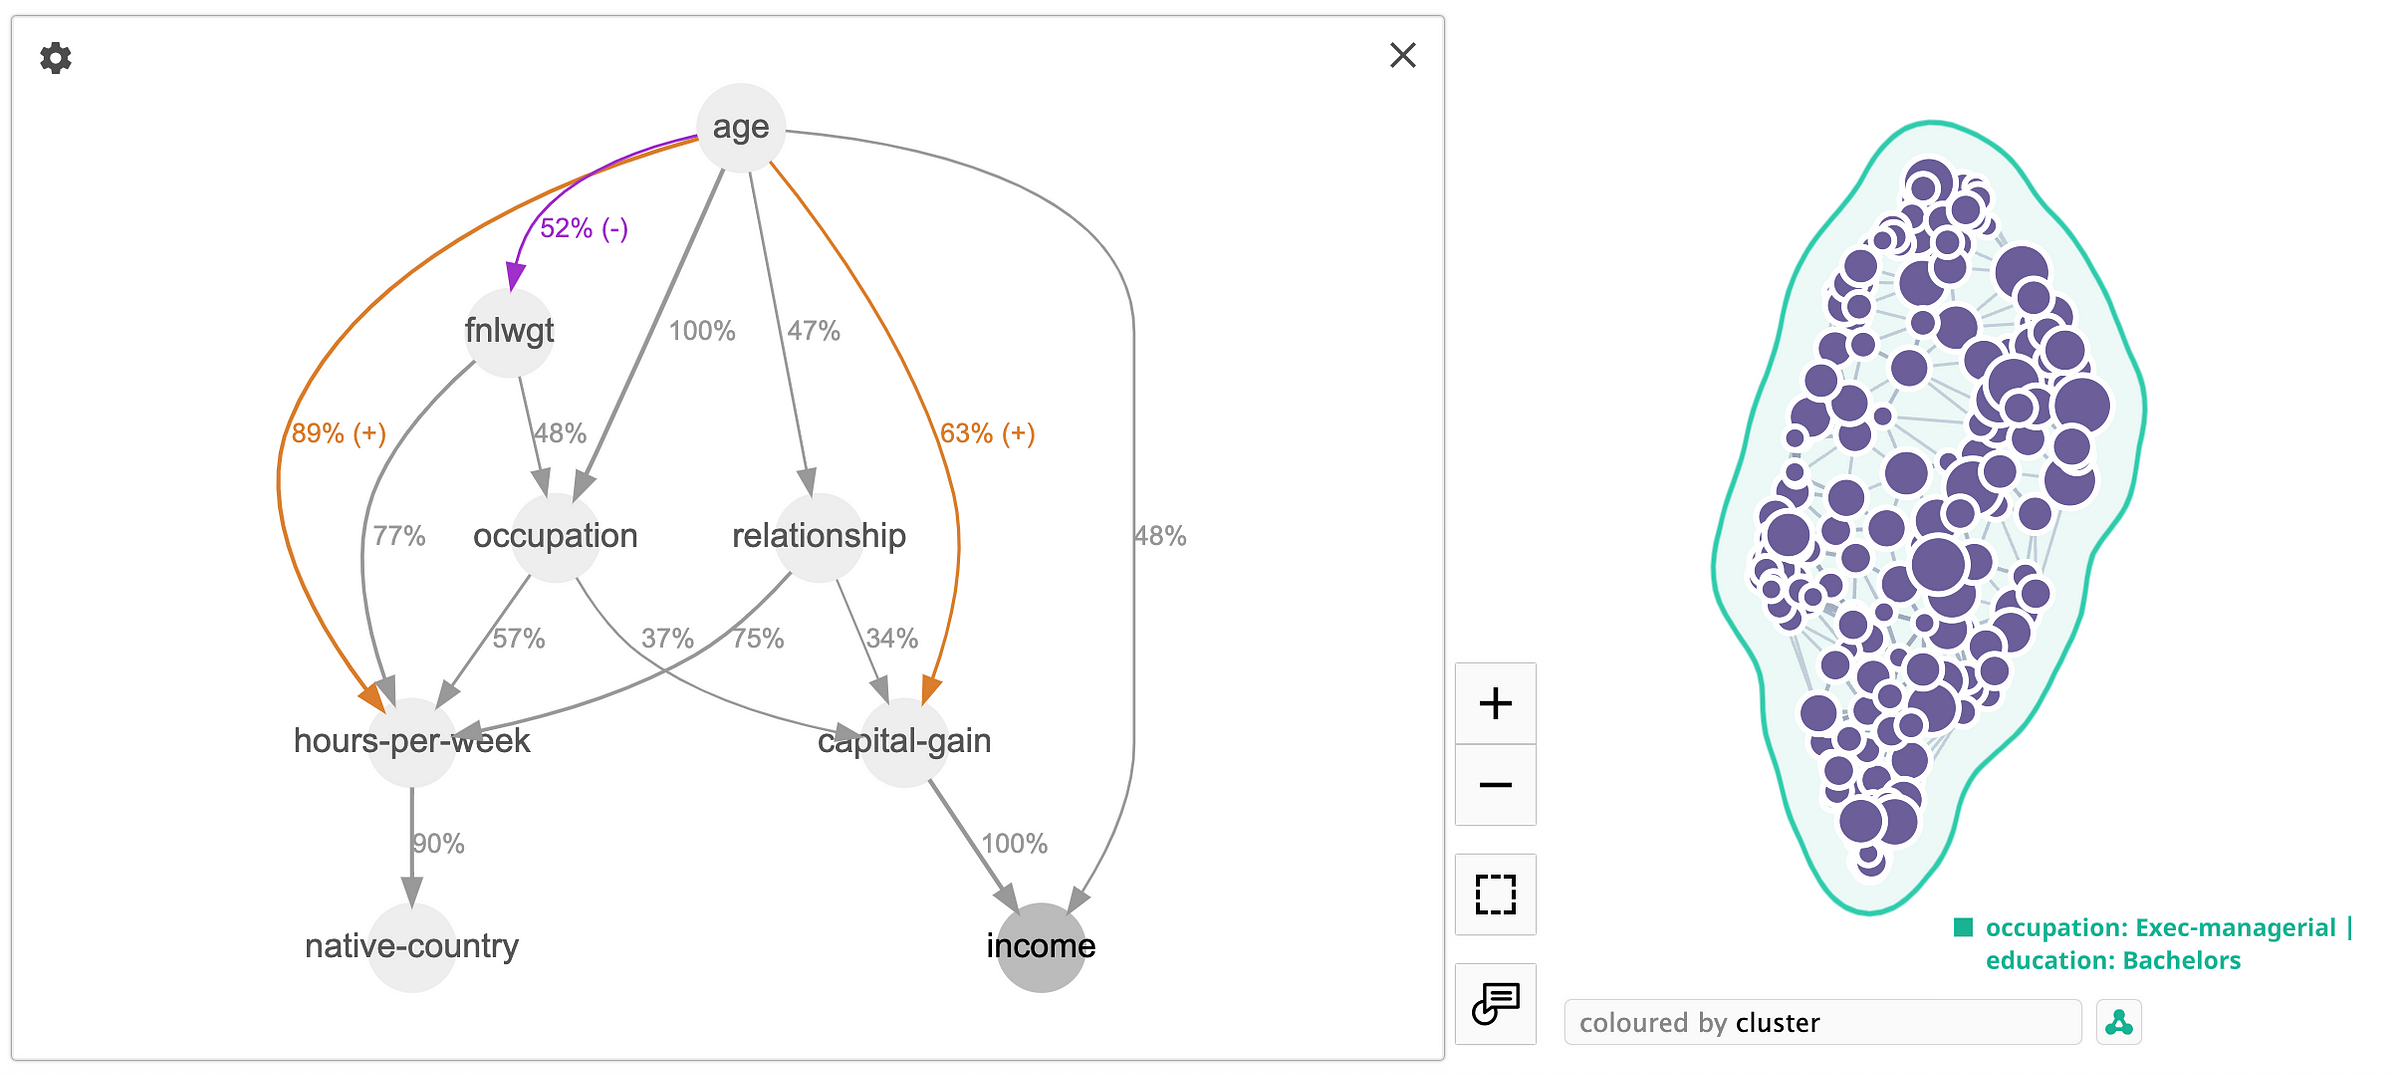
These two cluster examples illustrate the significance of avoiding a blanket application of causal discovery to the entire dataset and instead emphasize the need to careful analysis of the dependencies within each cluster individually.
Conclusion
The presented approach shows a significant enhancement to our Topological Data Analysis (TDA) analytics platform and its application in Root Cause Analysis. Our method holds promise in providing coherent and interpretable explanations for complex algorithmic predictions, aligning with human intuition. Nonetheless, to ensure its applicability in real-world scenarios, further user studies are needed.
In summary, the incorporation of causal discovery into our TDA framework opens up new avenues for unraveling Root Cause Analysis within complex datasets. This powerful synergy enables the visualization and comprehension of data interdependencies, offering practical benefits across various domains. While boosting trees, in combination with TDA, offer a robust methodology, it's important to acknowledge that no approach is perfect. Nevertheless, for the majority of our clients' use cases, the boosting trees approach represents the most effective solution available.
References:
[1] Causal connections between socioeconomic disparities and COVID-19 in the USA: https://www.nature.com/articles/s41598-022-18725-4
[2] Adult Census Income dataset: https://www.kaggle.com/datasets/uciml/adult-census-income
[3] Auto-mpg dataset: https://www.kaggle.com/datasets/uciml/autompg-dataset
[4] Bike Sharing Dataset: https://www.kaggle.com/datasets/lakshmi25npathi/bike-sharing-dataset
[5] The Book of Why: The New Science of Cause and Effect by Judea Pearl
[6] Causal Inference: What If (the book), by Miguel Hernan
[7] Simpson's paradox: https://en.wikipedia.org/wiki/Simpson%27s_paradox